I’m curious about Rise fo the Resistance. I have a question which seems tailor-made for Touring Plans and its audience.
While the attraction is famous for being awesome and technologically complex, it has also been hampered by downtimes. In fact, it seems that this is still very much the case. I’m wondering how committed Disney as a whole is to troubleshooting things.
After all, it’d be terrific if a visitor to the park didn’t have to worry about boarding groups, and the adventure could be run at capacity.
I would have thought that with the Disneyland version being down for a year significant work on the attraction would have been a priority. However it seems to be still running at a capacity which is below the park’s current 25%. Does anybody know what is being done vis-a-vis this attraction?
I don’t know why, but I’m kind of obsessed with this attraction and the idea that it ought to be running more reliably after all this time.
I’m going to suggest you follow ThrillData - It’ll give you all the info you could ever want about capacity / downtime
If you think about DLR vs WDW, you have to remember that the WDW team has been going almost nonstop, with only a short closure for COVID, since RotR opened. Heck, the WDW team even opened a month sooner.
IMHO - it’s no surprise that the DLR RotR is experiencing down times since reopening this week. That team hasn’t had anywhere near enough experience operating / maintaining it.
Disneyland did very little maintenance / construction work during the last year or so. They have Avengers Campus and that’s about it. (Snow White’s Enchanted Wish was “basically” done before the shut down & was supposed to open right before the closure)
This is due to financial cuts as well as construction / COVID issues.
Also, this has been stated in multiple threads, that the parks, both DLR / DHS, oversell the admissions. There is literally no way, even in “normal” times, that every person who buys a ticket can get on the ride. The hourly capacity can’t meet up with the number of tickets sold.
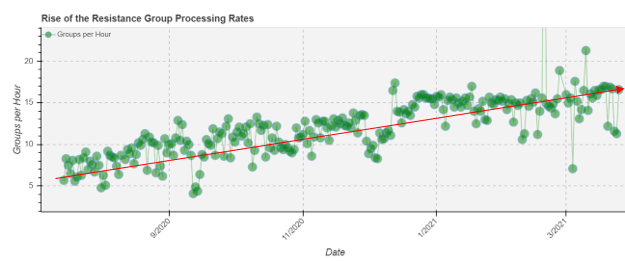
I have a separate thread where I have been tracking improvements in WDW’s RotR operations over the last year. Disneyland is already doing better than WDW was in July when it reopened, so I think it will catch up soon.
In particular, look at this chart for BG processing rates per hour. Vastly improved. The fact that DL hit 134 BGs on reopening day is already quite remarkable. WDW wasn’t reliably hitting that number until December 2020.
Hi! Thanks for the ThrillData info! I didn’t know about that site. Now I’m going to go down some data rabbit holes for the rest of the month. Very cool. It seems that my estimations of downtime were exaggerated (somewhat) and that things are on the upswing so that’s great news.
I’ve been holding off on my next visit (to either coast’s version) until there’s a very good chance that I’ll get to experience ROR, so I’ll keep looking for more info.
It seems that in answer to my question, the parks have been working hard to improve the throughput. That’s reassuring.