It’s been a few months since I’ve updated my RotR stats! For the most part, things have been great, so I haven’t felt the need to. There were a few days along the way where things went horribly awry.
Note: Make sure check out this great thread by @bebe80 for step by step instructions on getting a BG!
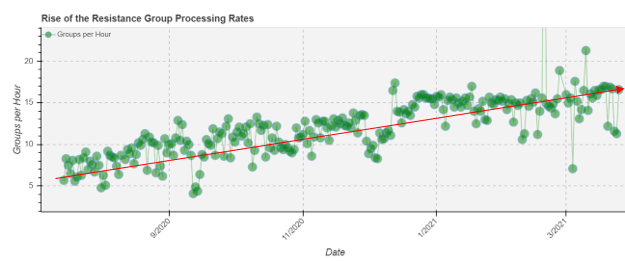
Processing Rates
RotR’s operations have been relatively steady since late December at 16 BGs/hr. A “bad day” is now between 10-15 BGs/hour, which used to be above average. You can see one day in early March when they processed less than 10/hr. They’ve had one day over 20. (There is also what is clearly an outlier that goes off the chart to almost 50, so I cut that off. ![]() )
)
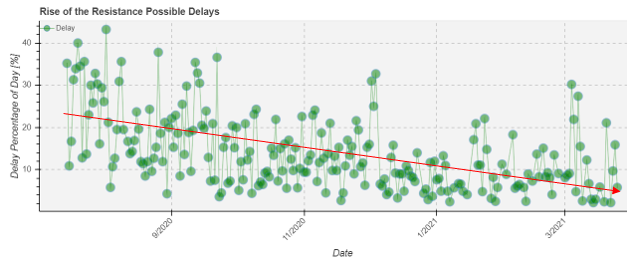
Delays
This last week was not as good as late December for downtime, but still much better than early on in the post-COVID reopening. The fact that processing rates have remained high implies that the plexiglass and other operational efficiencies are helping even when there’s downtime.
| Week | Delays / day | Min / delay | Total downtime |
|---|---|---|---|
| July 15th | 4.4 | 37 | 1150 min |
| Oct 1st | 2.6 | 29 | 530 min |
| Oct 14th | 2.4 | 29 | 500 min |
| Nov 9th | 2.7 | 28 | 525 min |
| Dec 22nd | 1.1 | 29 | 230 min |
| Mar 19th | 1.7 | 28 | 340 min |
Downtime
The “median” downtime is now around 5%, but there are still some days where it pops above 10 or even 20%. (note: this may capture cleaning cycles since a “delay” is measured as any time a new BG is not called for more than 15 min).
I’ll probably do one or two more of these in a couple of months to see if they ever eliminate those “bad days.” But overall I think they’re doing a great job. It’s definitely more reliable than Test Track or other older rides with operational issues.