Hopefully it keeps running well consistently.
1 Like
I guess it’s a good time for an update on operating metrics for RotR!
Processing Rates
First up, RotR has been operating remarkably consistently for almost a month now, averaging about 11 BGs per hour. With HS open from 10am-7pm (9 hours), that means they will approach or exceed 100 BGs on most days. Back in July, they were averaging ~7 BGs per hour. There were 3 days before 9/15 when they barely hit 4-5 BGs / hr. ![]() So there has definitely been improvement on this metric!
So there has definitely been improvement on this metric!

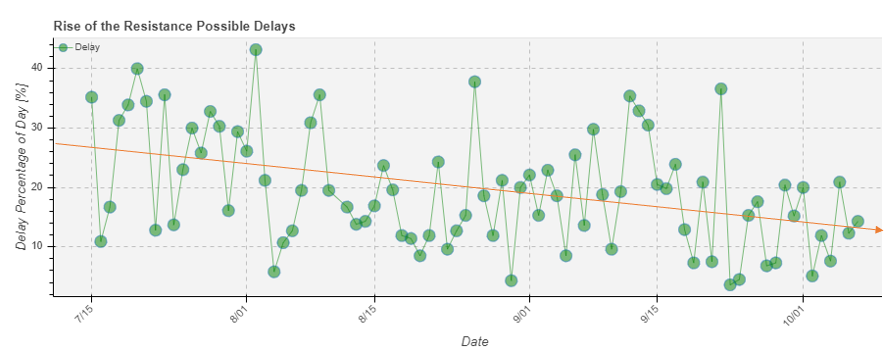
Delays
As a reminder, the denser and higher the dots in this chart, the more and longer the delays. It looks like over the last week or so, delays have clustered around the 20 min mark, with only a few 40-60 min delays. Compare to how dense the delays were in July. Side note - it’s hard to say how cleaning delays factor into this.

Downtime
The last “bad” day for downtime was 9/22. On most other days since, downtime as a % of the operating hours has hovered around 10-20%, which is really good! The red line was added manually by me based on my eyeballing the average % downtime over time. As you can see, the average downtime has trended from 30% in July to 20% in September and is now closing in on 10% in October.
All data is pulled from Thrill Data.
3 Likes
Zooming in on the Delays chart above, here is what the week of July 15th looked like compared to the week of October 1st:
July

October

Below I took the liberty of counting up the individual delays and determining the average downtime (for science  ):
):
| Week | Delays / day | Min / delay | Total downtime |
|---|---|---|---|
| July 15th | 4.4 | 37 | 1150 min |
| Oct 1st | 2.6 | 29 | 530 min |
As you can see, the frequency and length of delays is much improved - and a small change in reliability can make a big difference over the course of a week! Think of all the people that can experience the ride in those extra 600 minutes (10 hours!) of operation in October compared to July! That’s like having an entire extra day of the week when the park is open!
4 Likes
We love Science. And Ellie
2 Likes
There are various ones. I like Xfinity.
Regarding this, WiFi is generally better than mobile data as far as highest download speed goes. I’m not an expert on this, but there must not be a difference in app speed when reserving a BG? (Maybe because it’s just a simple App) Especially since some people got BG 2 off of cell towers. Anyone want to touch on this?
1 Like
I’ve been practicing the last couple of days and have been unsuccessful. I’m noticing that the app hangs up for a hot second going through my friends looking for people to add to my party. Do you think that might be part of the problem? I have a lot of friends (31) that I really don’t want to delete because adding them back in would be horrific.
1 Like
I’m not entirely sure. It’s possibly a factor. But I wouldn’t think the page would take any longer to load. It’s not like the app is searching to see who is in the park. That step comes next. Do you have a good signal? I’m assuming you’re on WiFi?
1 Like
A couple of people have reported this lately. I’m wondering if it has to do with your connection? If not, it could be an issue with the Disney server that needs to be sorted out.
1 Like
I was on WiFi the last few days, but today it was cellular. I’ll try again tomorrow on WiFi and report back if it works.
Do a speed test beforehand if possible. If you’re in a location in your home with spotty WiFi, that could have an impact.
3 Likes
Time for a quick update on BG stats!
Processing Rates
Processing rates have continued to climb from an average of 7 BG/hr in July to 11 BG/hr in late October. On a “bad” day, RotR is processing ~8 BGs/hr, which is better than a “good” day in July! We haven’t had a truly bad day since mid-September (knock on wood).

Delays
Delays per day and average delay time has remained steady in October, but significantly better than July, which explains the overall trendline.
| Week | Delays / day | Min / delay | Total downtime |
|---|---|---|---|
| July 15th | 4.4 | 37 | 1150 min |
| Oct 1st | 2.6 | 29 | 530 min |
| Oct 14th | 2.4 | 29 | 500 min |

Downtime
Daily downtime started at around 25% with high variability (sometimes over 40%!) in July, and is now averaging closer to 13%, with many days under 10% (hard to imagine it being much lower than that with cleaning time).

Overall, operationally RotR is in a much better spot now than it was in July or August, and even September! Anecdotally, there have been fewer instances of the ride experience being abbreviated or simplified, though that can still happen.
5 Likes
1 Like
Boarding Group called at 9:40 on a 10:00 open.
3 Likes
Time for a RotR stats update! Once again, all charts are from Thrill-Data
Distribution
There were a couple of days where distribution lasted more than mere seconds, but that seems to have been a fluke rather than a trend. Make sure you are familiar with the process before you arrive at the park! For advice on the process, try this great thread by @bebe80!
Processing Rates
We’ve continued to see a positive trend in BGs called per hour, and therefore total number of BGs called in a day. It started at ~7 BGs/hr in July and is now averaging over 12 in November! A “bad” day is now less than 10 BGs/hr, which has only happened once (11/5) since late October. I assume adding capacity (plexiglass barriers) is part of this but operational efficiency is also important.

Delays
Delays per day and average delay time has remained relatively steady since October but still much improved over July:
| Week | Delays / day | Min / delay | Total downtime |
|---|---|---|---|
| July 15th | 4.4 | 37 | 1150 min |
| Oct 1st | 2.6 | 29 | 530 min |
| Oct 14th | 2.4 | 29 | 500 min |
| Nov 9th | 2.7 | 28 | 525 min |

Downtime
The ride is now running close to 90% of the time most days, with up to 20% downtime on “bad” days, compared to days with over 40% downtime back in July and August. I don’t think we’ll see much more improvement than this until the cleaning cycles are no longer necessary.

In summary, RotR has been operating quite smoothly since mid-September. Hopefully this will continue going forward and perhaps improve or at least have less variability.
4 Likes
It kind of makes you wonder why they still call it a 10:00 open.
1 Like
I think it’s good they call the BG’s early, everything else is running. They can get a couple extra groups through each day. And I’m sure they would give you til 11:00 to check in, even if it says 10:40.
1 Like
Yeah. It would be quite surprising if they didn’t. So, basically the earlier BGs will be given slightly longer windows.
I think Disney is trying everything they can to help with increasing overall capacity, and this will help.
1 Like
“our boarding group was called at 9:40AM — before the park had even opened!”
I believe the author meant: “officially” opened
1 Like
Hehe. Good catch!
It is good to know, if this continues, since we have three days (well, 2 and a 1/2) at HS planned. The 10:00 opening isn’t really opening. Since we’re at Boardwalk, it is easy enough to walk over and get ahead of the main crowds if we so desire.
1 Like
Was in line in the car at 8:50. At 9:05 exactly they started letting people in. We were on the park by 9:15 and rode Smugglers run and toy story mania by 10:00. In line for RRC now…
We got boarding group 86 from the house for ROTR, but they still didn’t call a single group yet…uhhhh
2 Likes