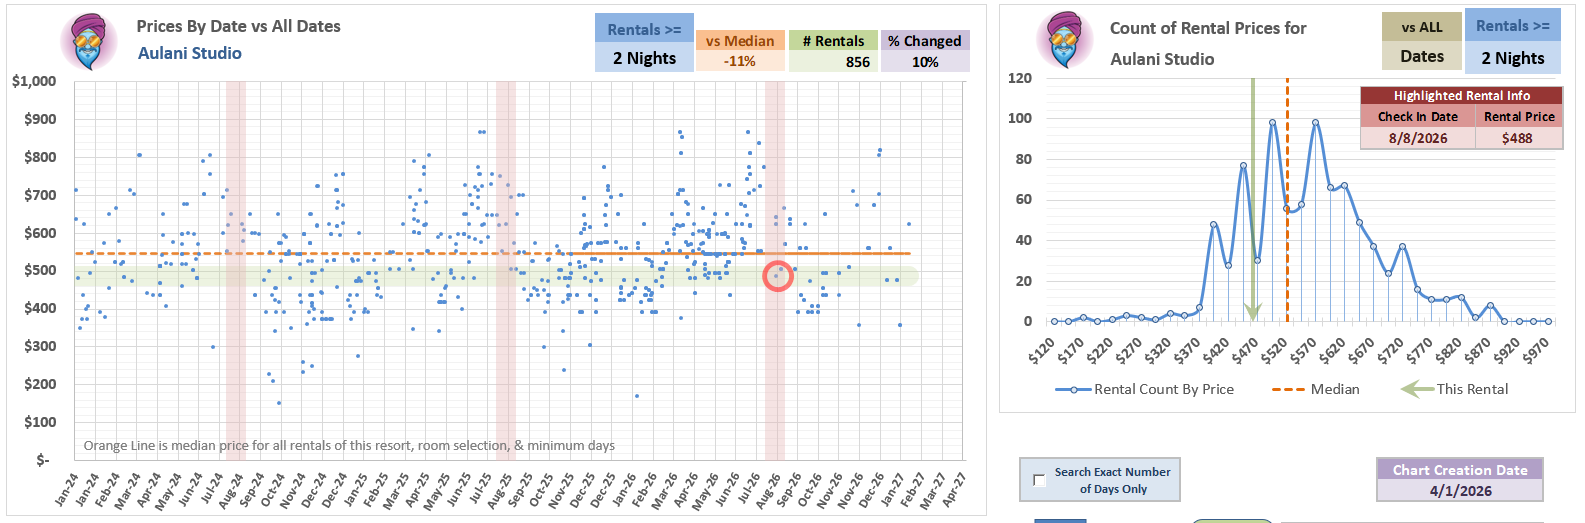
There are plenty of times of the year where you can find Aulani dedicated rentals well below this price. But, for August, this is pure win - especially for a rare-ish 6-nighter
6-night Aulani Studio 08/08 for $488/night or 19% under median
I wonder if this is just something that happens naturally. The further out dates are, the more flexibility owners have with their points. Renting out a longer stay is probably easier due to availability, but also most 1 or 2 nighters usually result from expiring points being burned for a reservation that they can then flip to sell.
Yes, all studios for the Poly, I didn’t differentiate sub-location in my data. Does not include Duos, unless some slipped through as regular studios in the beginning.
I don’t think there’s a trend for longer stays early in the year, but that’s more of a feeling than my having checked yet.
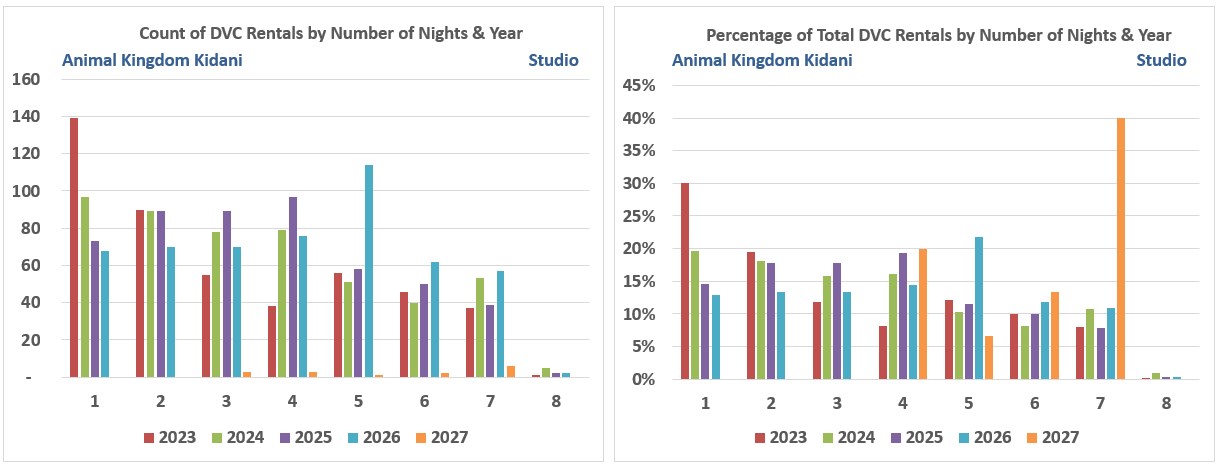
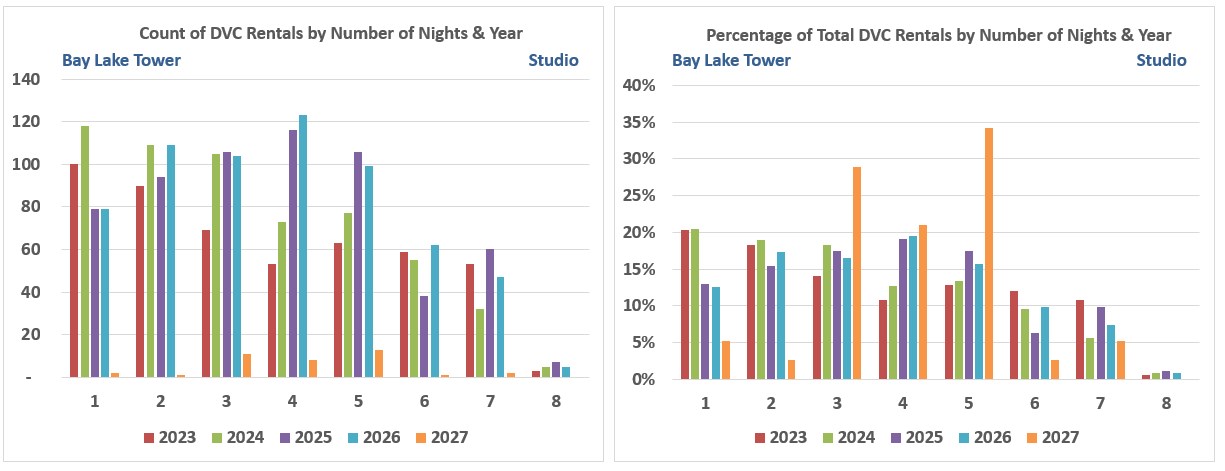
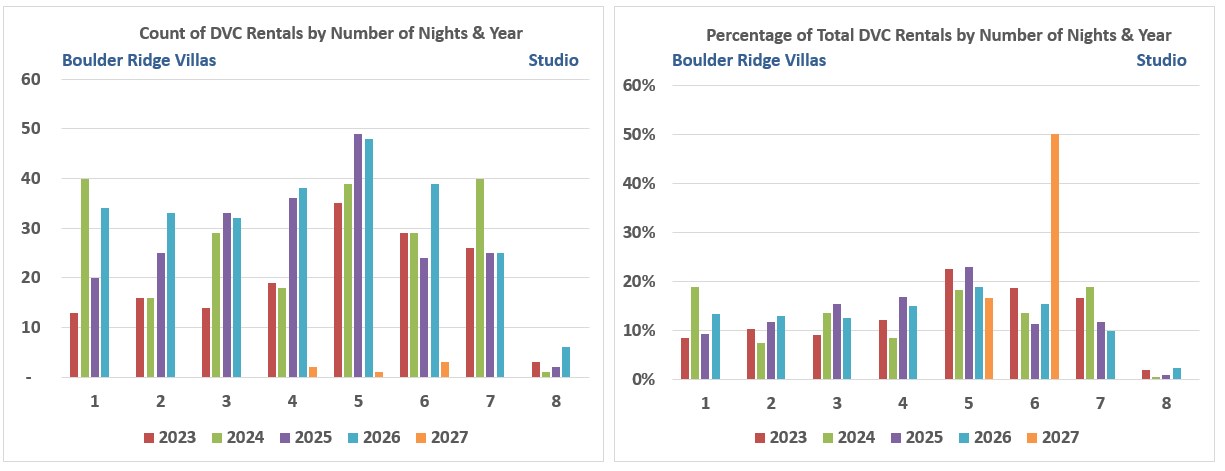
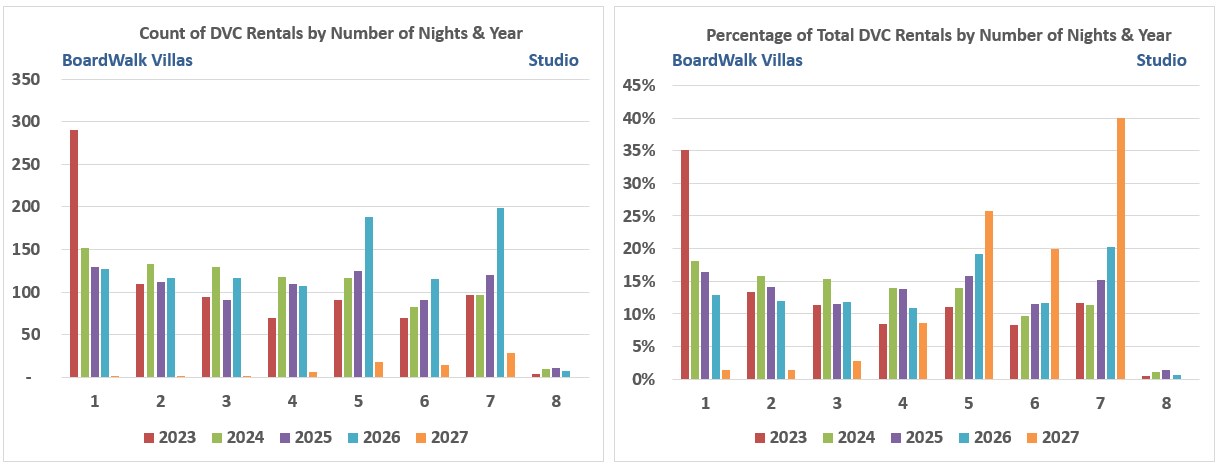
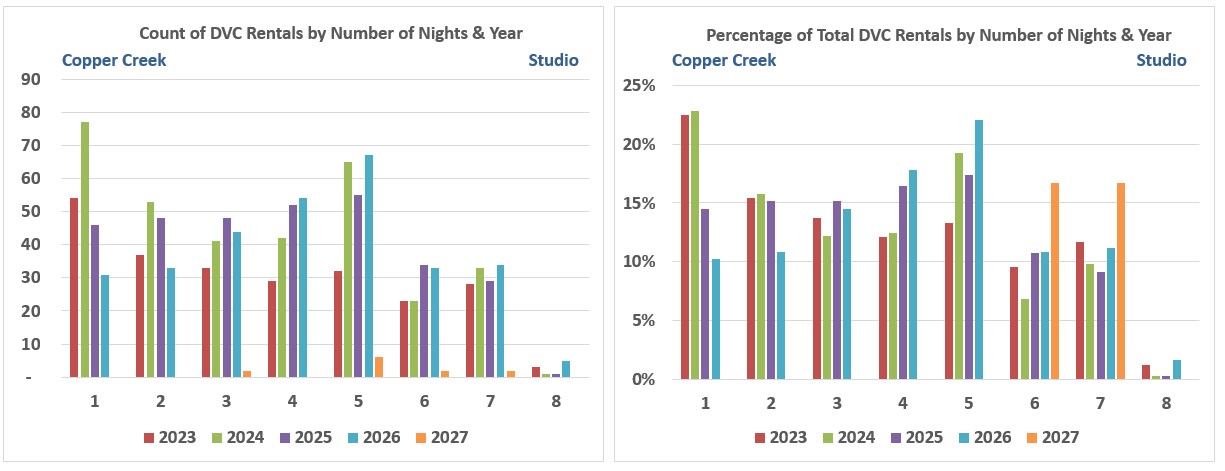
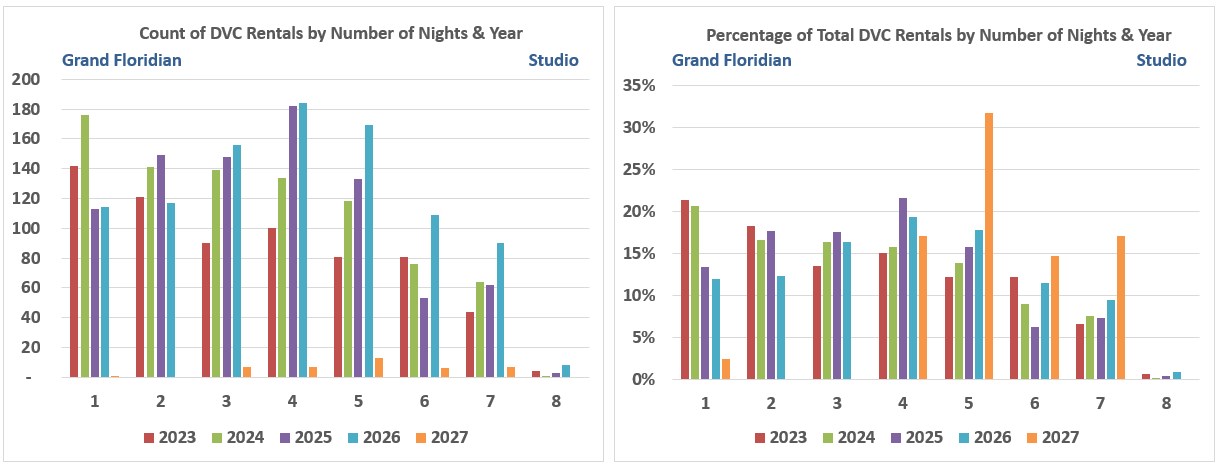
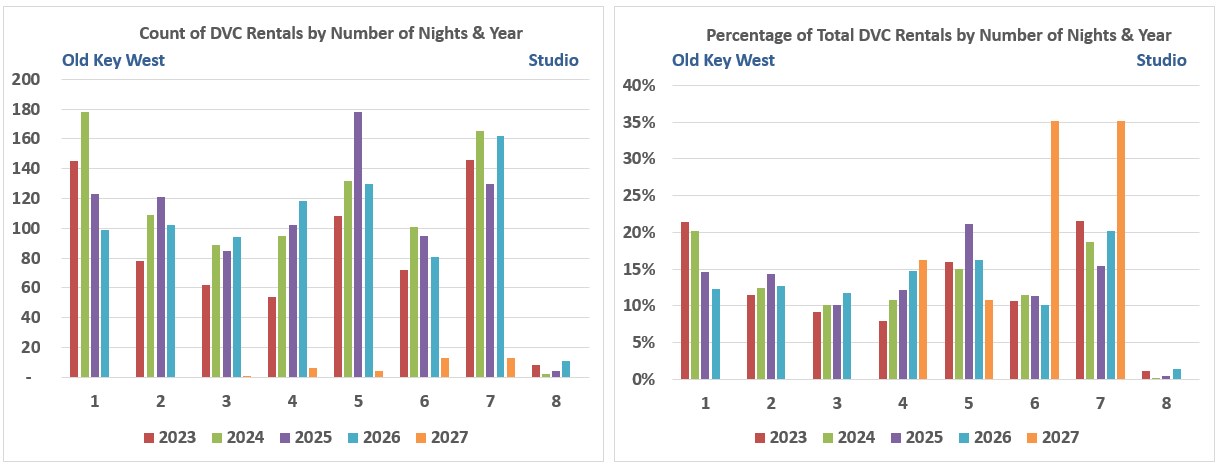
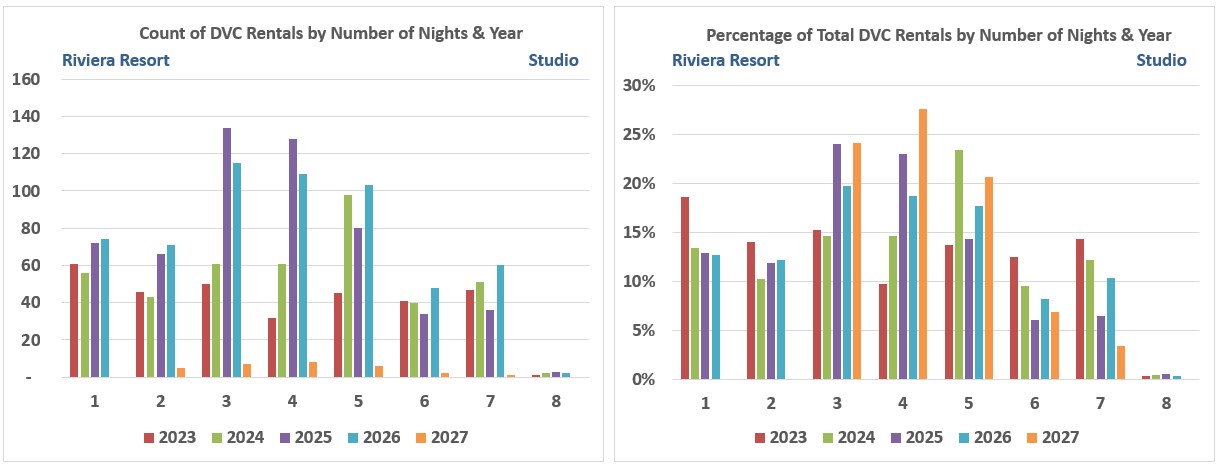
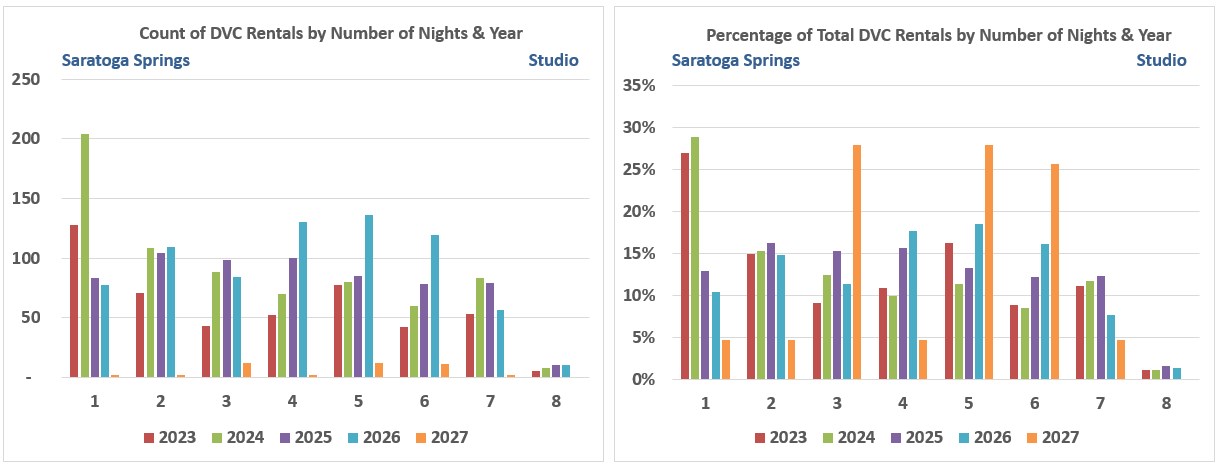
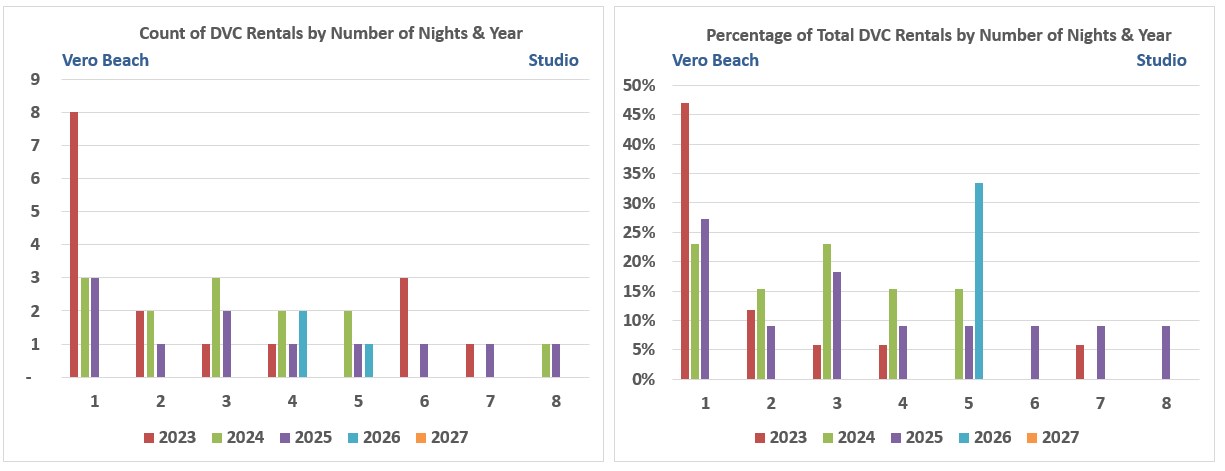
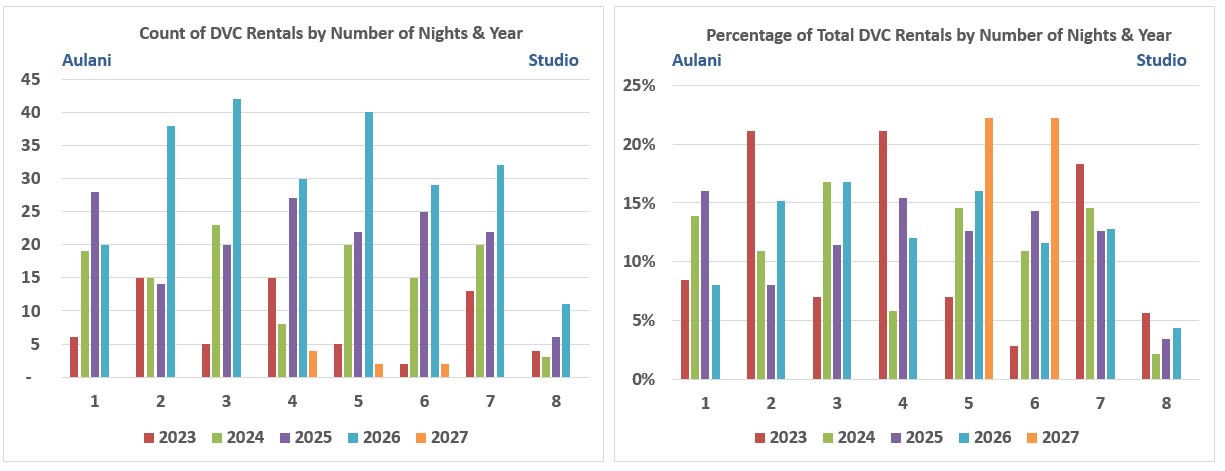
I did run the resort level charts, will try to upload them tomw. Most are following same pattern shift to longer, though some a more dramatic than others.
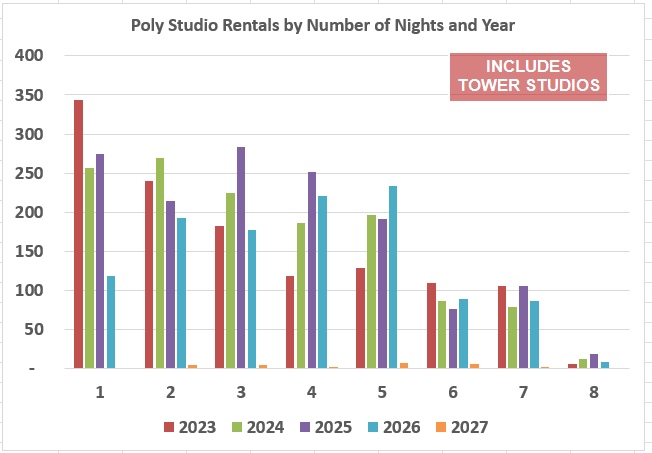
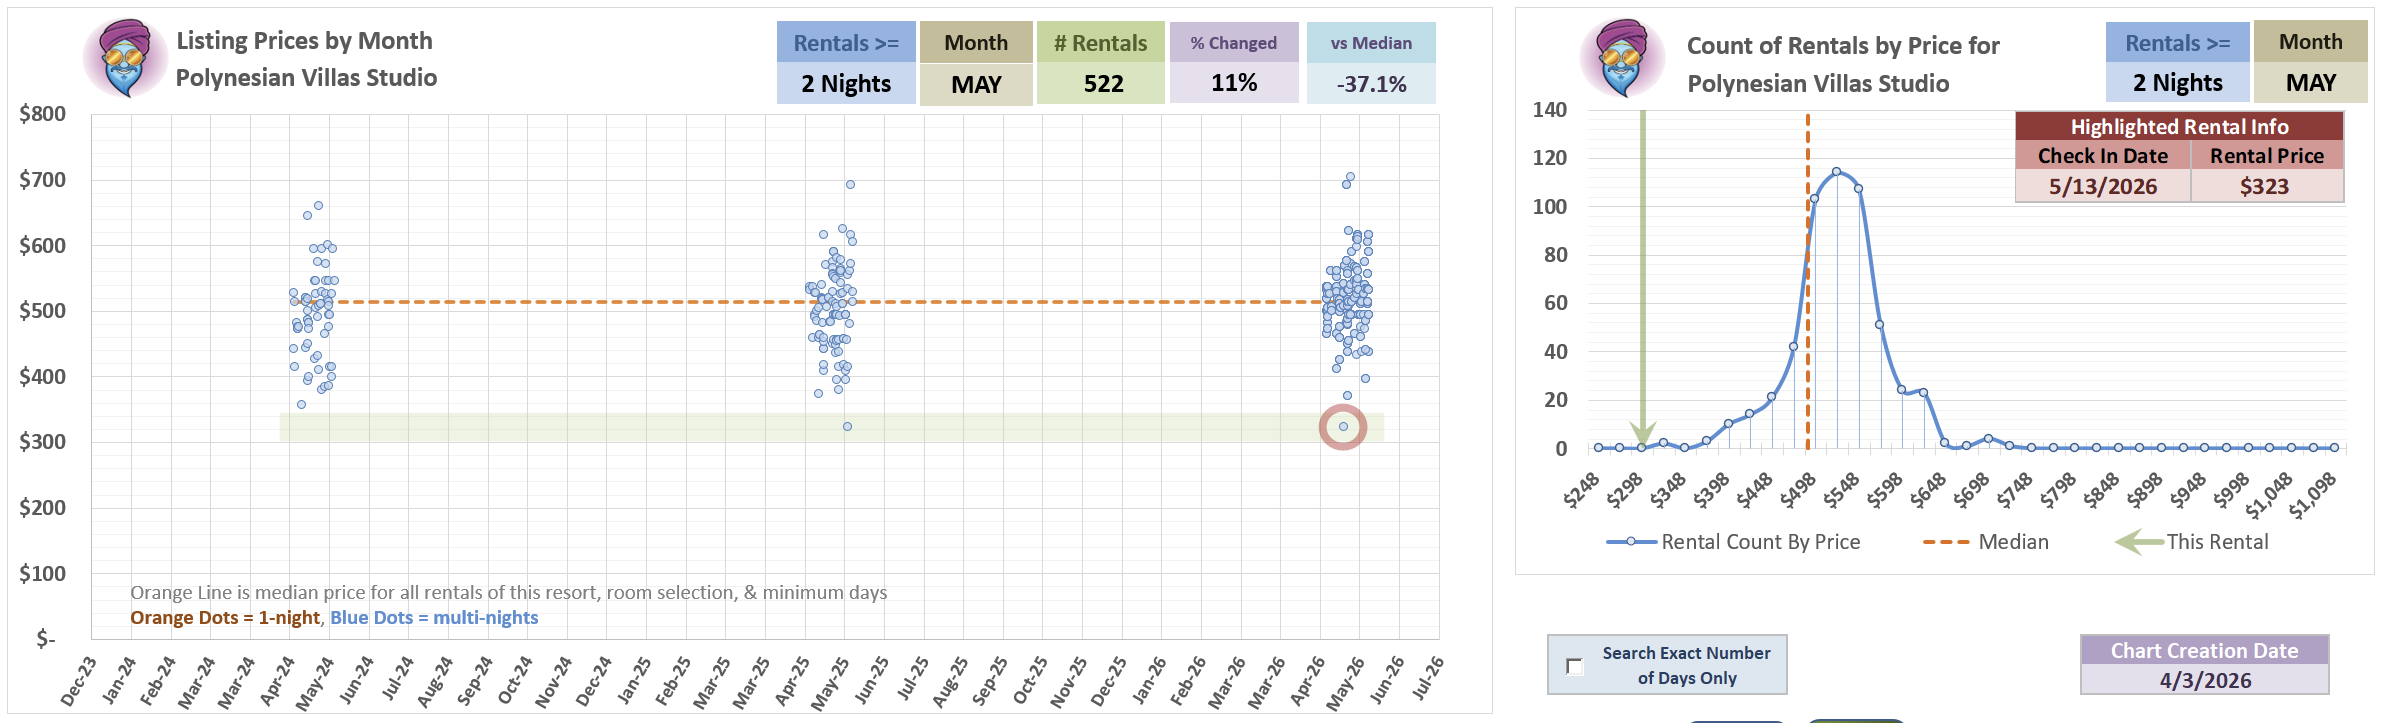
The reason I ask about the Poly studio example is because the Tower opened in mid December 2024. So if we factor out the remaining weeks of that year to just call it 2025 for cleanliness purposes and consider that Studio units at both Poly properties increased by about 38% not counting Duos, you can kinda gauge that 1 nighters barely moved when Island Tower opened from 2024 - 2025, 2 nighters dropped, and the popular picks were for 3 & 4 nighters compared to the previous year when Island Tower wasn’t open. That 1 & 2 night trend holds for 2026, but it seems the 3 nighters shifted over to the 4 & 5 night stays instead.
That’s probably the trend I’m interested in seeing in your charts across the other resorts. It reads like Owners are just renting their points out for a more preferable vacation length for non-DVC guests now.
Truthfully, I really just believe that this is cyclical due to no major expansions at WDW or Disneyland happening for awhile. I think the shift back to the 1 & 2 nighters will happen more slowly over a couple years.
And just because I like mismanaging your time, have you ever taken a look at the number of nights actively on the market, rather than listings? Maybe that would be a better indicator, or at least a useful one, of Owners actually using vs selling their points?
Unrelated: I just think it’s funny that someone new may come to this thread and see that they’d need to spend almost 12 hours reading it to catch up on our nonsense
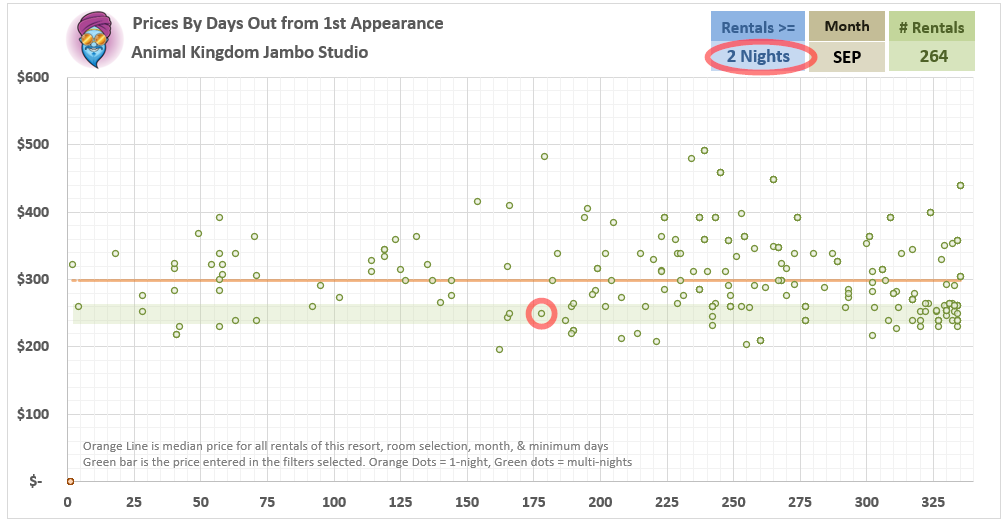
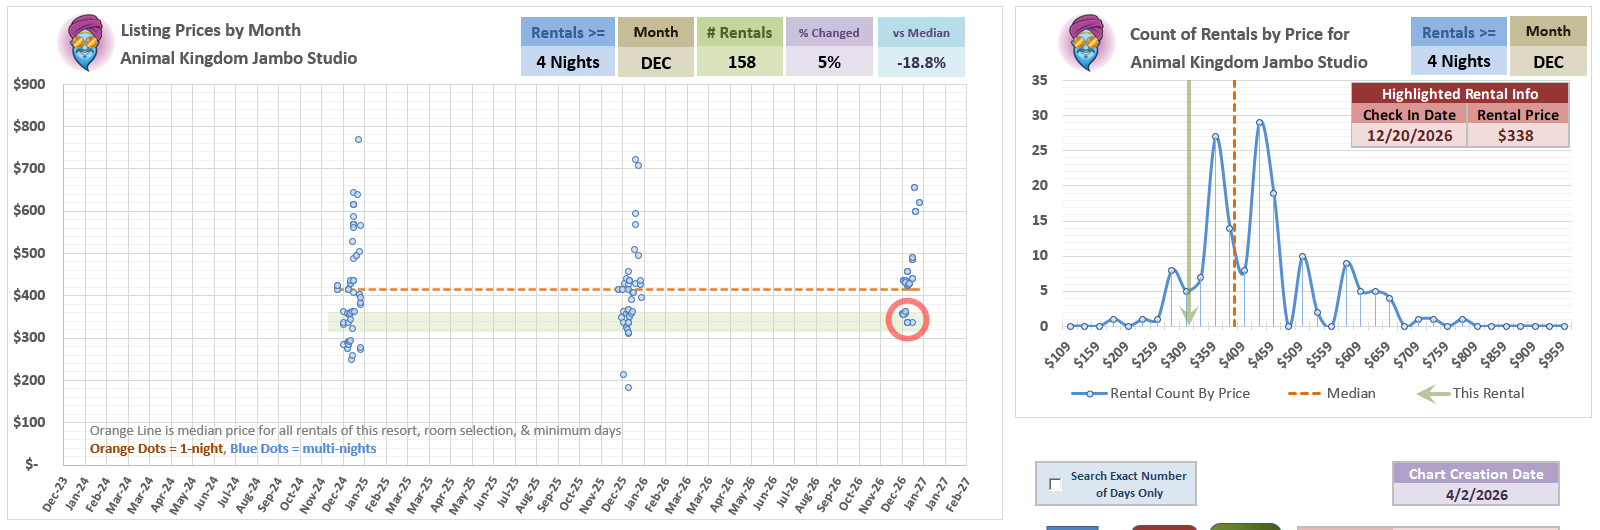
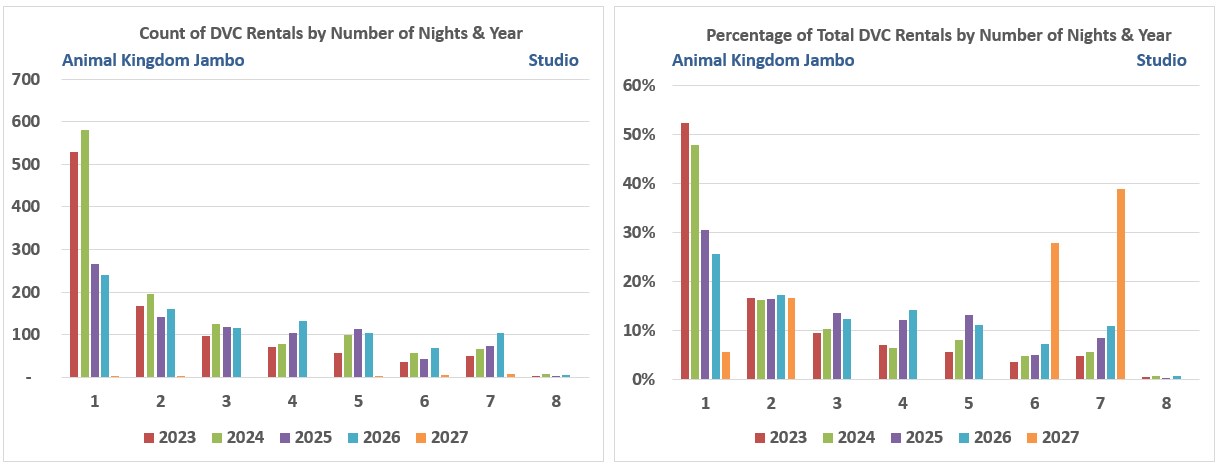
Analysis on all 3 of these Jambo studios is similar, even if the price point changes between the Sept and Dec listings.
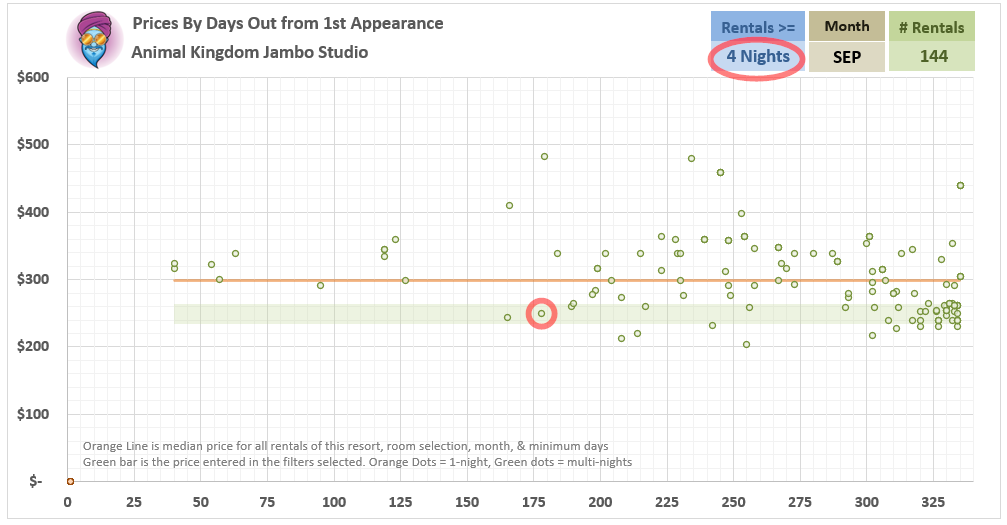
While it is possible we might see some lower priced Jambo rooms for Sept, it doesn’t seem very likely especially for 4-nights or longer. Most of the lower ones recorded were shorter stays and the majority of those were back in 2024.
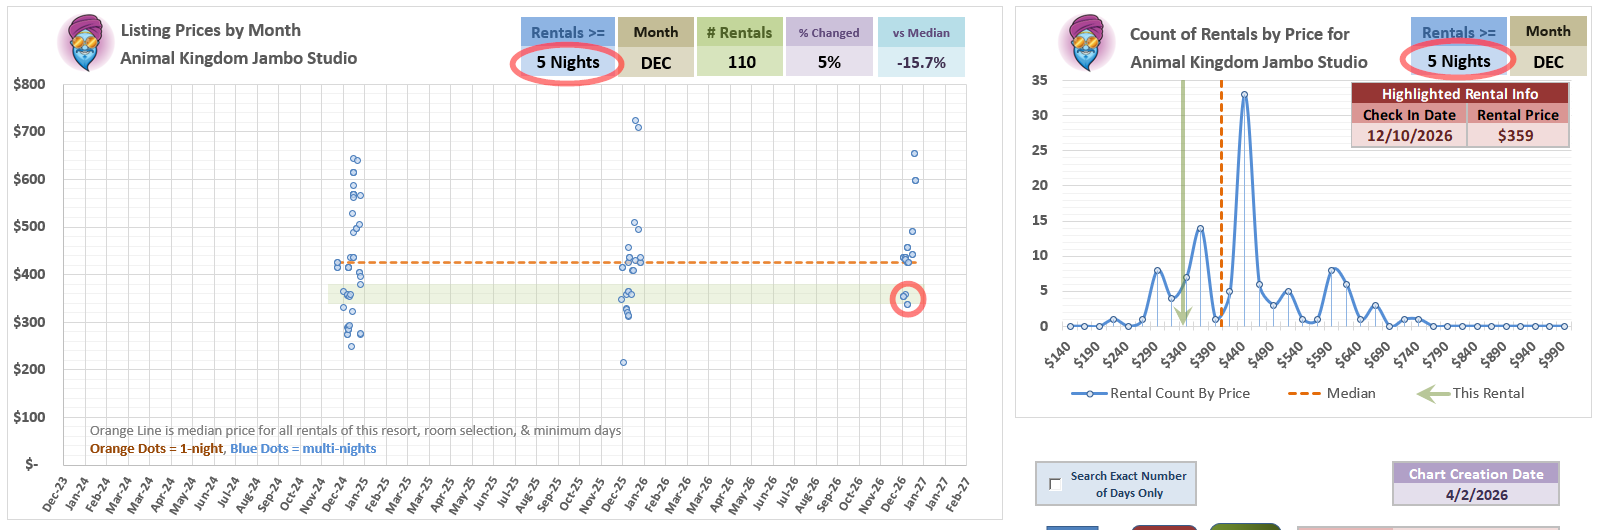
For Dec, kind of the same. While you can see in the chart there was a larger batch of Jambo listings around this price last year as well - ALMOST ALL of them appeared back at the 11 month window.
So, If I wanted a longer stay in Sept or Dec, I’d jump on these.
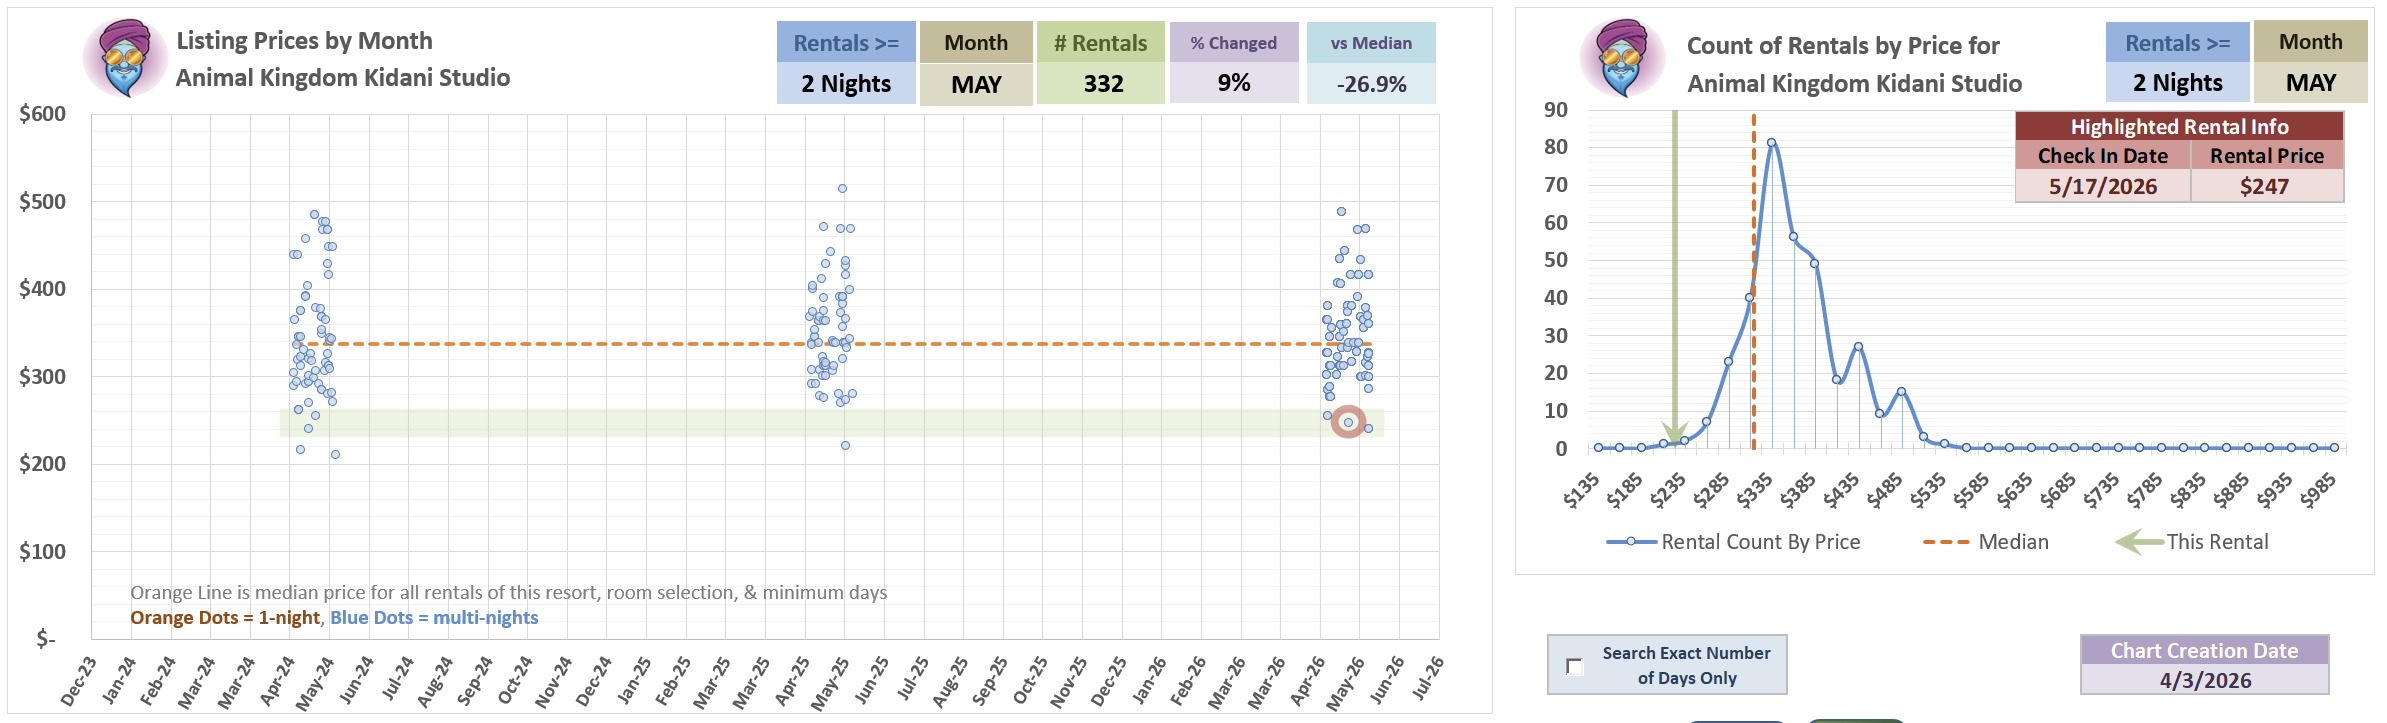
4-night AK Jambo Studio 09/27 for $249/night or 13% under median
I wonder if we are going to see more longer dedicated rentals vs those 1 and 2 nighters. (ETA: It appears that is a trend) I have benefitted twice from a nice dedicated rental but I also appreciate Disney looking out for DVC owners- the ones that actually go do Disney.
Same! I’m the one brining down the hammer though, lol. I told DH we have to use points and discounts for anymore 2026 travel. I need to remind myself I"ve been to Disney this year and I want to wait for a lot of the new things to come online before I plan a Disney trip again. Plus I want to do Universal and Disneyland next.
I like this trend!
I’ve wasted 12 hours in worse ways… just saying. I love the in depth analysis.
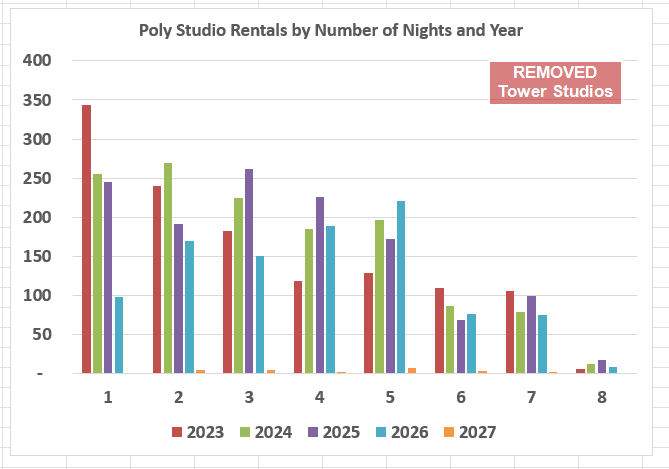
OK, Because I keep the original room type descriptions in the raw data, was pretty easy to excise any Poly listing with the word “Tower”. (Have to assume the rental sites were consistent in using that word for those listings, but who knows.)
Here’s the with Tower studios chart (copied from above) and without.
(272 Tower studio listings were removed in total.)
Note, these first two charts include all listings for the previous years, which skews things since we’re only in April in 2026. See last charts below for a normalized version.
Added Later: For next charts, below:
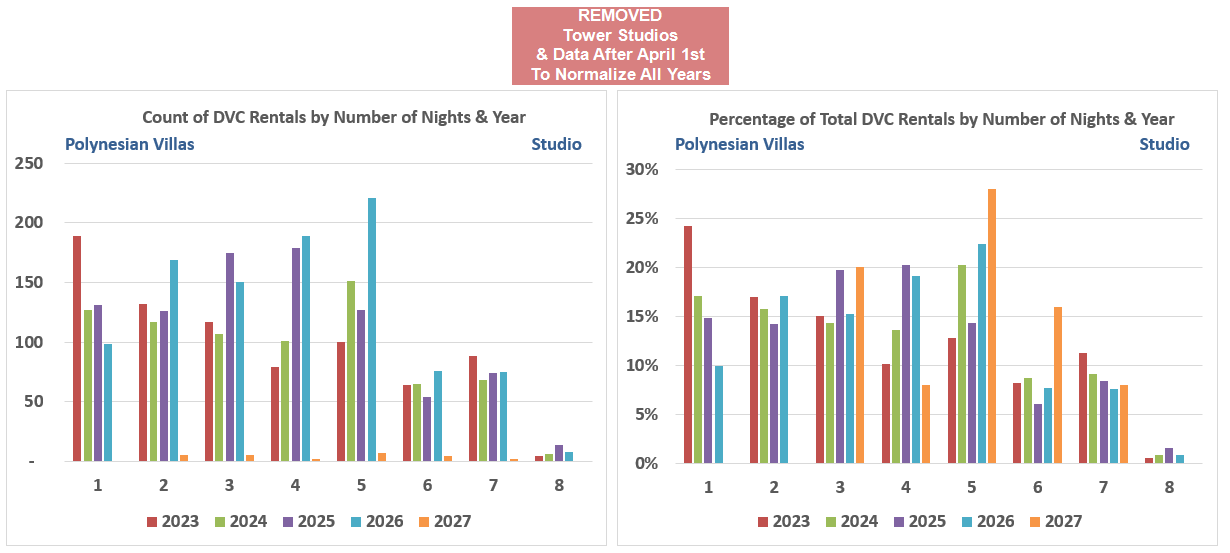
Since the data I have in the current year goes to April 1st, I normalized the data for other years by removing any listings that appeared after that date in the year the listing starts. That should make these charts the most accurate depiction of how things are changing. Unless I borked it.
Sometimes I need to walk away for awhile to realize I made any mistakes. I don’t think so, but if something occurs to me later I’ll fix.
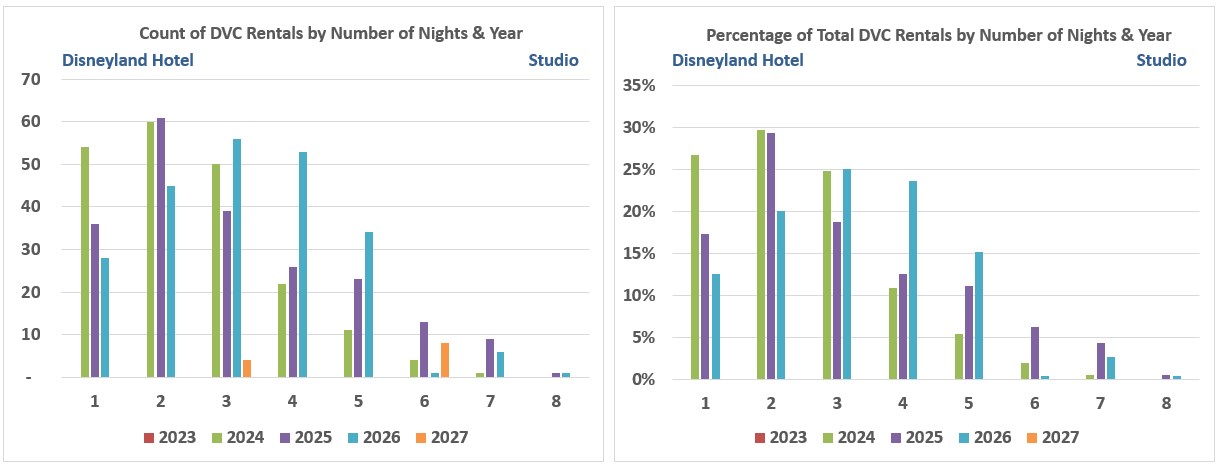
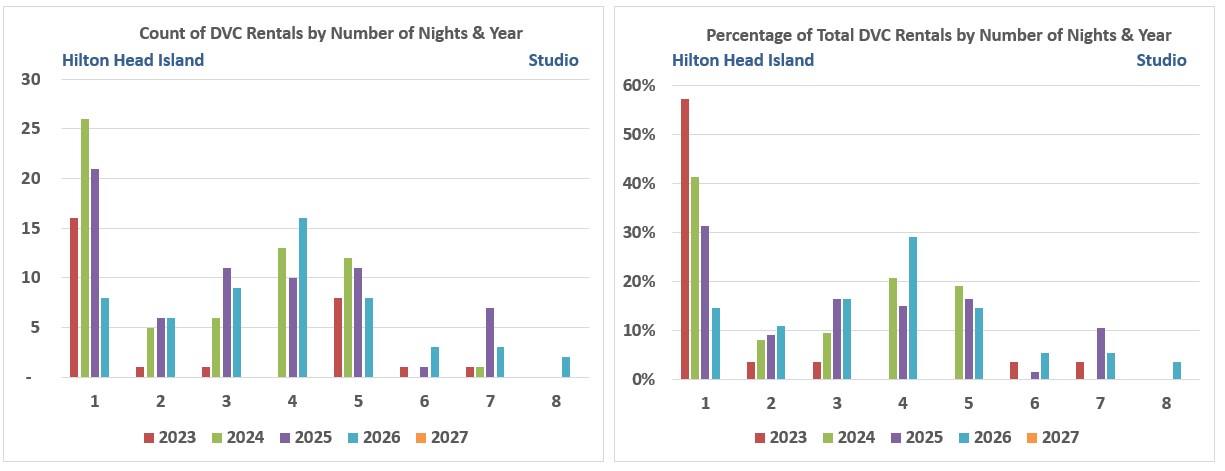
Charts: Count of Listings by Number of Nights by Year - Studios
Data notes:
Charts generated 4/2/2026
Data includes listings that were in place as of April 1st each year, no later.
(I used data as of that date in 2026.)
No Poly Tower Studios since they weren’t out there in 2023 and most of 2024.
It is VERY early for 2027 data, so be aware some of those ginormous 2027 spikes for longer stays might go down as more 2027 data appears. Only time will tell.
Pricing like this makes me wonder if some brokers are open to offers.
I know a lot of them just put up a form and say ‘fill this out to reserve the listing’, but they all check their general contact us form inbox pretty regularly so there may be bartering possible.
If I had upcoming trip plans I’d definitely reach out about a listing, ask if they’re willing to move on the price, point to some data for reasoning, and see what happens.
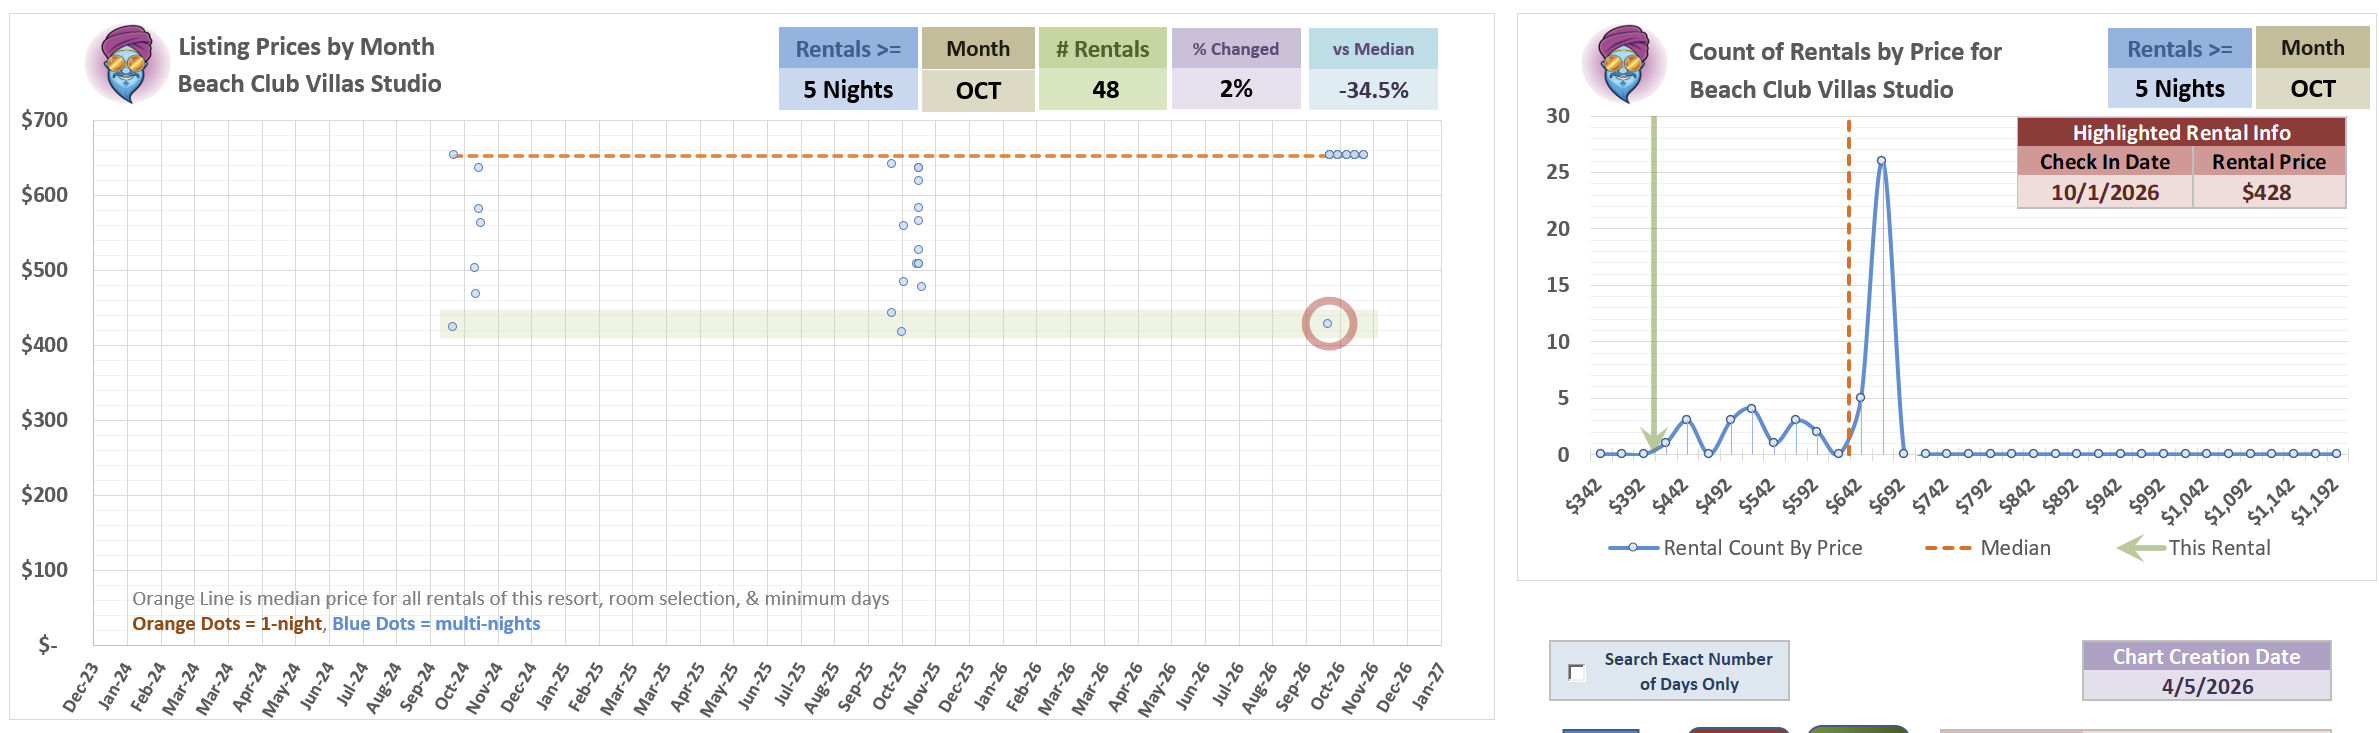
Looking at the chart, I think the % under median might be better than I’m posting here, might be time for me to recalculate those monthly medians again.
When you limit the comparison to just 5-nights or longer, you an see this is a very rare low price and length combo for October!