Epic Universe Touring plan issues

I’ve started going attraction by attraction at Epic to look at:

  • the ratio of actual wait times to posted wait times
  • ride downtime
  • the 90th percentile of posted wait times (instead of the average)

I should have updated wait-time models by early next week.

The good news is that we’ve got 800 actual waits in the past couple of months from the core 12 attractions. (And way more for things like Ministry than, say, Yoshi’s. So that’s good too.)

The ratio of actual-to-posted wait times is all over the place at some attractions. At Curse of the Werewolf, for example, some people wait 20% of the posted wait, others wait 160%, depending on the time and day. And that’s after kicking out the outliers.

That doesn’t give me a lot of faith that the posted wait times are accurate.

I suspect a lot of this comes from ride downtime and weather.

That gets a little better when you look at that ratio over a couple-hour period. Right now I’m looking at one-, two-, and three-hour timespans.

I suspect these models will be better. But we’re going to need more data, better weather, and hopefully more uptime on the rides, to see some stability here. I’ll probably have to do this again in a month.

8 Likes

Oh, and for Toothless specifically, recent actual-to-posted ratios are running 40-70%, so a posted wait of 50 should be an actual wait somewhere between 20 and 35 minutes.

6 Likes

All great information! Thank you for your hard work

3 Likes

It’s kinda funny how the ratio of actual-to-posted drops off a cliff at Stardust Racers right after lunch for about 2 hours.

Perfect time to get on the park’s fastest coaster!

6 Likes

If it is running. Don’t know what is up with that ride (rides?) but it seems every time we look at the app, SR is offline. Maybe we just have bad luck when we try to sample.

Hoping by February it is running more consistently.

2 Likes

Probably because it’s still summer so the rain is hitting consistently each afternoon! February is far less rainy (and less lightning when it rains) so you should have better luck.

3 Likes

It is just SO slow moving. We rope dropped Toothless as in lined up at 9:45, walked with purpose straight there and were still about 12-15 back and waited 35 minutes. It’s crazy how physically short the actual line is and it’s consistently posted 65-95 minutes which felt accurate.

4 Likes

That seems somewhat accurate if they are planning 2 to 2 1/2 minutes per person.

1 Like

Yes, based on my pictures we were there about 3 minutes. But my point is that I don’t see a 20 minute wait being realistic for most of the day.

2 Likes

Yeah, makes sense. Seems like an awfully long wait for a photo op!!

I’ve re-done all the Epic models, with a focus on the last couple of weeks that include changes to the Express Pass lineup.

We’ll be testing the plans in the park starting Monday, so I expect to test on Monday, Wednesday, and Friday before releasing these new models.

A couple of assumptions I’ve made for the models, since we’ve only got around 3.5 months of data, and those data are laced with ride breakdowns and weather delays:

  • We haven’t seen an actual crowd level higher than 5, since the park is limiting attendance right now.
  • We used the 90th percentile of wait times at each crowd level, after discarding outliers
    • The median/average didn’t seem like a great idea because ~half the waits would be higher than that, by definition.
    • The 80th percentile would probably also have worked as a guideline - I’m not saying the 90th is some magic number.
  • We had enough actual wait times, spread well enough across the day, to calculate the hour-by-hour ratio of actual waits to posted waits at most attractions.
    • The actual-to-posted ratio varies considerably throughout the day
    • For the other attractions, we had enough data for a two- or three-hour chunk at a time.
  • Guests will start lining up for Mine-Cart Madness in Super Nintendo World before its official opening. That means someone can’t head there at official opening and expect a walk-on. This is a new model change.
  • The park is generally open for around 12 hours per day (720 minutes). The models go out a bit more than that, just so we’re prepared if the hours change.

Here’s Harry Potter and the Battle at the Ministry as an example of actuals and posteds, for a Crowd Level 5 day:

About 45 minutes after the ride opens, the 90th percentile posted wait is around 150 minutes. But actual waits are averaging around 35% of the posted at that time. So it seems like the posted wait is more of a “please go elsewhere” signal.

The ratio gets more accurate in the last couple of hours the park is open.

Like I said, we’ll test this in the parks and adjust the models next week. Happy to answer questions in the meantime.

7 Likes

And here’s the plan from the optimizer. I’m interested in that Toothless meet & greet time, just like y’all. :stuck_out_tongue_winking_eye:

8 Likes

This is a cool graph!

Do you have it for Toothless? If we true “rope drop mode”ed it and still waited 30 minutes, I think it has to be 30-60 minutes for the majority of the day. I never once went by when the queue wasn’t full and that had to be 60+.

Have you been tracking CLs? We were there 8/24 and according to Thrill Data it was very low crowds.

2 Likes

I have a very specific question- We’re going to universal in the week of 11th to 18th October. Other sources (Thrill-data and Queue-times) suggest that, consistently, Sundays are the quietest day and Wednesday is the busiest at Epic, but the Touring Plans crowd calendar predicts that Sunday 12th is a 9, while Wednesday 15th is a 6 - the lowest crowd of the week. I understand that Monday the 13th is Columbus Day, but is that expected to have such a significant impact on Epic? The Monday holidays which have taken place so far this year ( eg Labour Day) don’t appear to have had that impact.

2 Likes

Columbus Day coincides with the beginning of Fall breaks for numerous school systems as well as creating a long weekend itself.

4 Likes

Here’s Meet Toothless & Hiccup:

3 Likes

Just so we know what we’re talking about, here’s the average posted wait time for each day of week (DOW) for Epic, from thrill-data, in minutes:

Monday = 51
Tuesday = 53
Wednesday = 56
Thursday = 55
Friday = 50
Saturday = 50
Sunday = 46

Epic Universe has only been open around 16 weeks. But for fun, let’s assume a bunch of things are true that are almost certainly not true:

  • The posted wait times are accurate
  • The posted wait times are consistent across all hours of the day
    • That is, Sunday isn’t slower because everyone goes home at 7 pm for work the next day, lowering the overall average for the day
  • No DOW had more problems than any other
  • No DOW had longer-lasting problems than any other
  • Weather didn’t affect any DOW more than any other
  • The standard deviation of wait times for any DOW is 5 minutes
  • The future is going to look like the past
    • E.g., weekdays in the fall when school is in session are going to look like weekdays in the summer, when school is not in session

And let’s assume that we only need to be 60% confident in what we’re saying - slightly better than a coin flip. This isn’t the New England Journal of Medicine, where we’d need 95%.

As a rough ballpark, the confidence interval is a little over 1 minute at 60% for 16 measurements of each weekday with a 5-minute standard deviation.

Then we could say that Sunday is probably the slowest day of the week.

We still wouldn’t be able to determine the rankings of Monday, Friday or Saturday, because they’re all within a minute of each other, so the confidence intervals overlap. And Tuesday overlaps Monday, but barely.

We couldn’t be certain whether Wednesday or Thursday is the busiest day, but it’d be close.

So we’d be able to say this, roughly:

  • Busiest: Wednesday, Thursday
  • Next-Busiest (probably): Tuesday
  • Next-Busiest: Monday, Friday, Saturday
  • Least Busy: Sunday

I mean, we’re talking a difference here of less than 6 minutes for 6 DOWs. Where you are in the rope-drop crowd is going to be vastly more important than the DOW you choose.

I could be wrong. :stuck_out_tongue:

ETA: I checked this morning and the standard deviation for the posted Epic U are these:

Monday: 43.4 minutes
Tuesday: 45.1
Wednesday: 46.5
Thursday: 43.1
Friday: 39.7
Saturday: 39.7
Sunday: 35.3

Even at a 60% confidence level, we still can’t yet say Sunday is less busy than Wednesday, because the confidence levels overlap.

Sunday’s confidence interval is roughly 36 to 50 minutes.

Wednesday’s confidence interval is roughly 46 to 65.

I think there might be something to the Sunday thing, but we’re not there yet.

Just playing with the confidence interval calculator, we might need 9 to 10 months of these same averages and standard deviations to be 60% sure just about Sunday. To be 90% sure we might need 2 years of everything being the same.

With the same average and std_dev, we’d need more than 10 years of data to be 90% confident we can differentiate Tuesday, Wednesday, and Thursday.

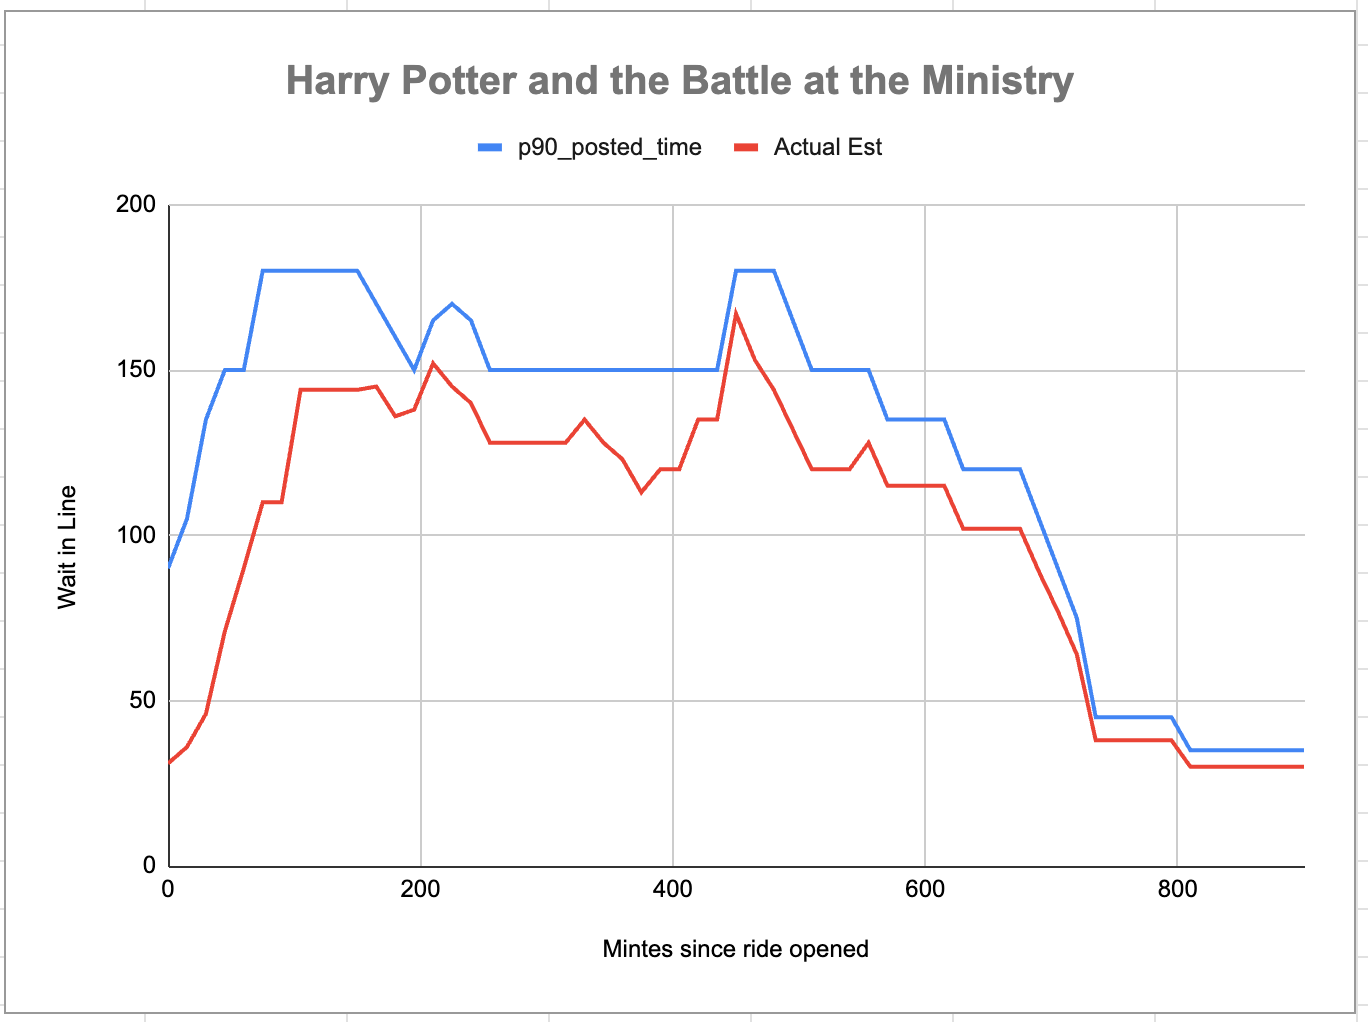
I really think rope-dropping and having a touring plan is vastly more important to how long you’re going to wait in line.

7 Likes

All of this sounds suspiciously like probability and statistics, and I just don’t like it. I don’t like it at all. :moose:

6 Likes

Thank you!

3 Likes

Thanks for going into so much detail - I’m rather ashamed to have put you to all the effort!

2 Likes