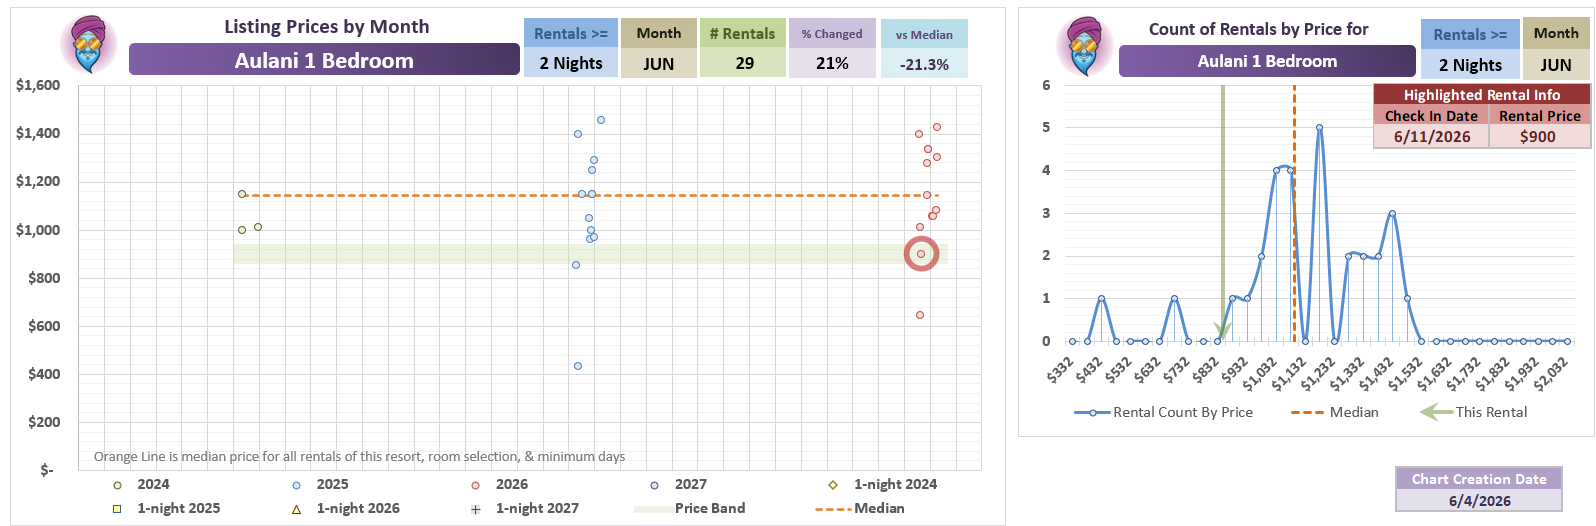
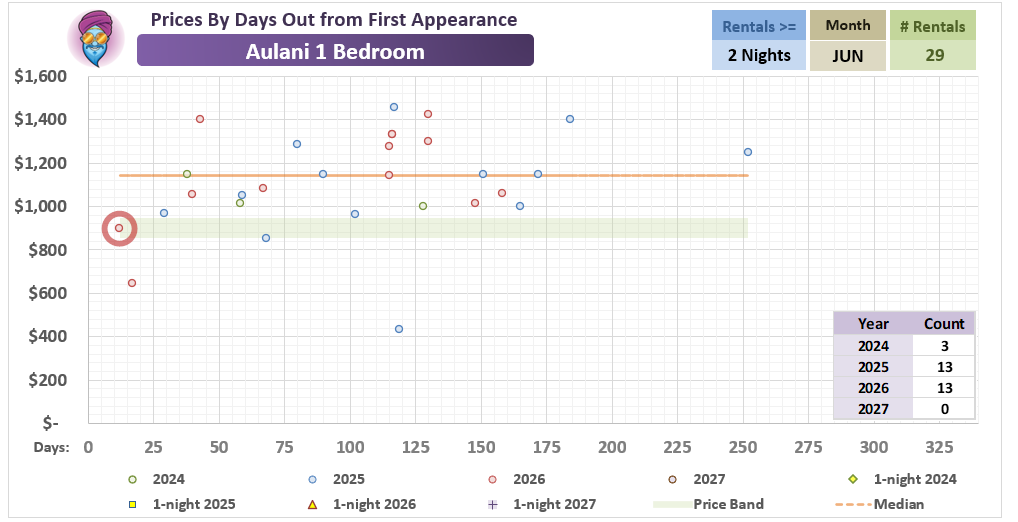
Last minute, especially for Hawaii, but excepting a couple of crazy rando listings, this is at the bottom of recorded prices for this room - and it is ocean view!
3-night Aulani 1 Bedroom Ocean View 06/11 orig $1,100/night now $900/n or 15% under median
As you can see from the count box on bottom right - quite an uptick in 6-night or greater this year. It doesn’t look like there are a lot of dots on the chart because many of them were 100% duplicates of each other.
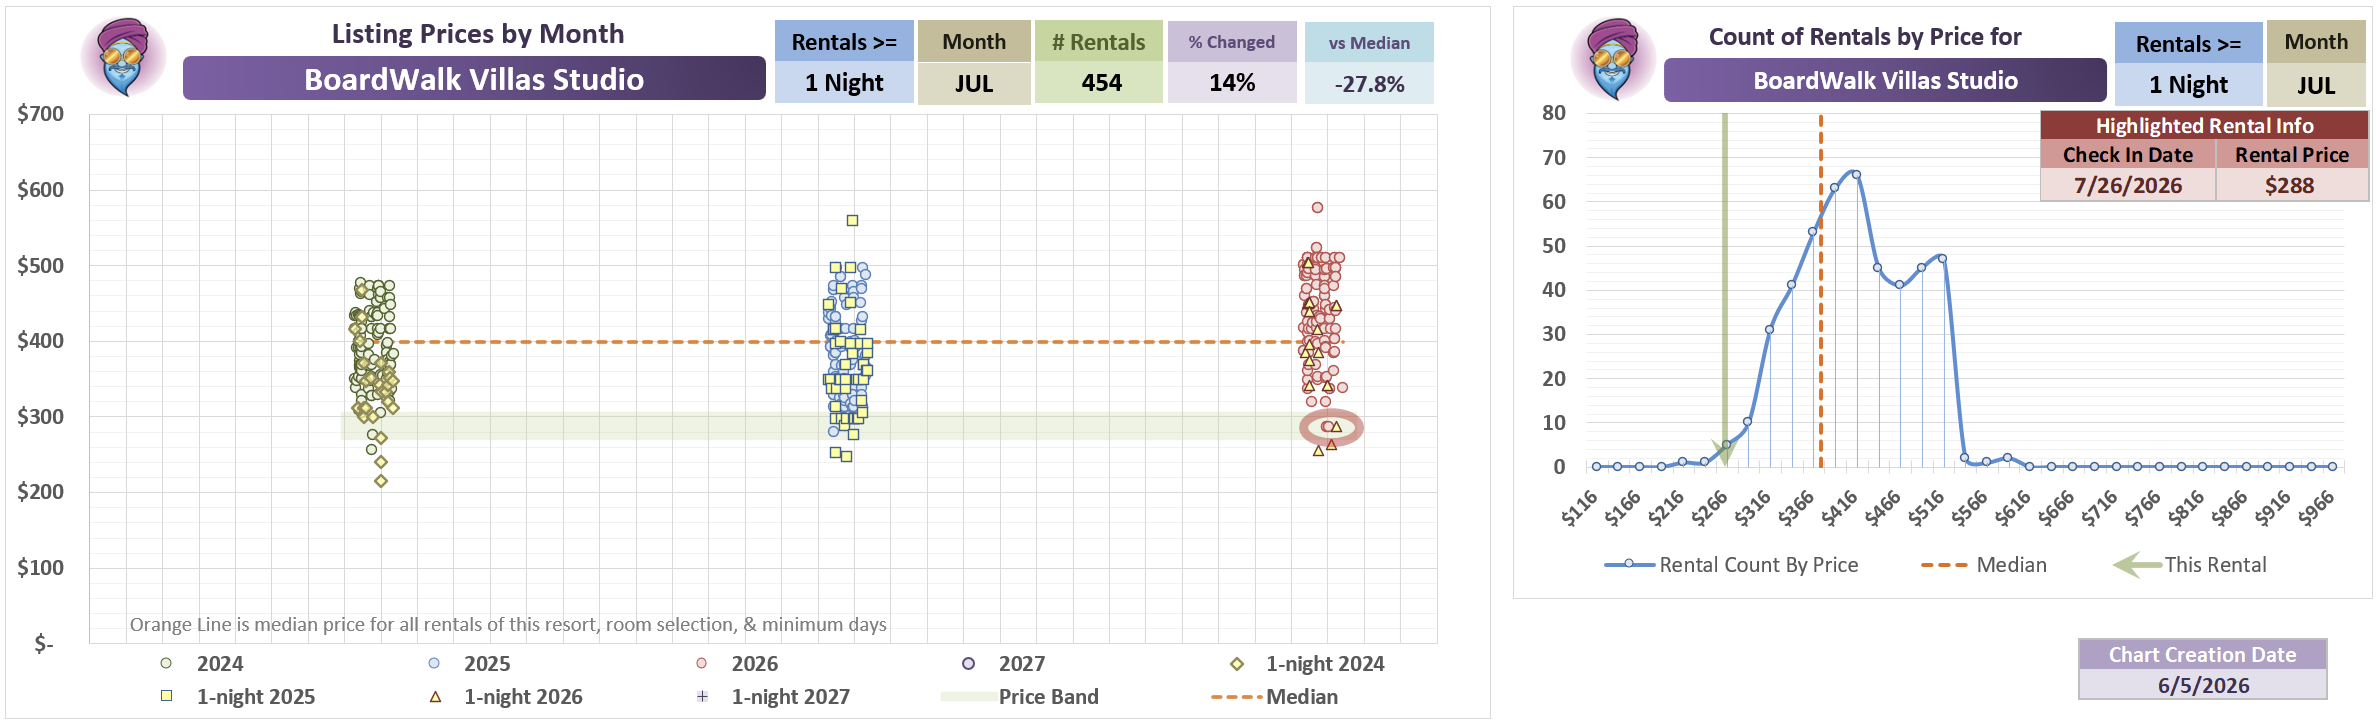
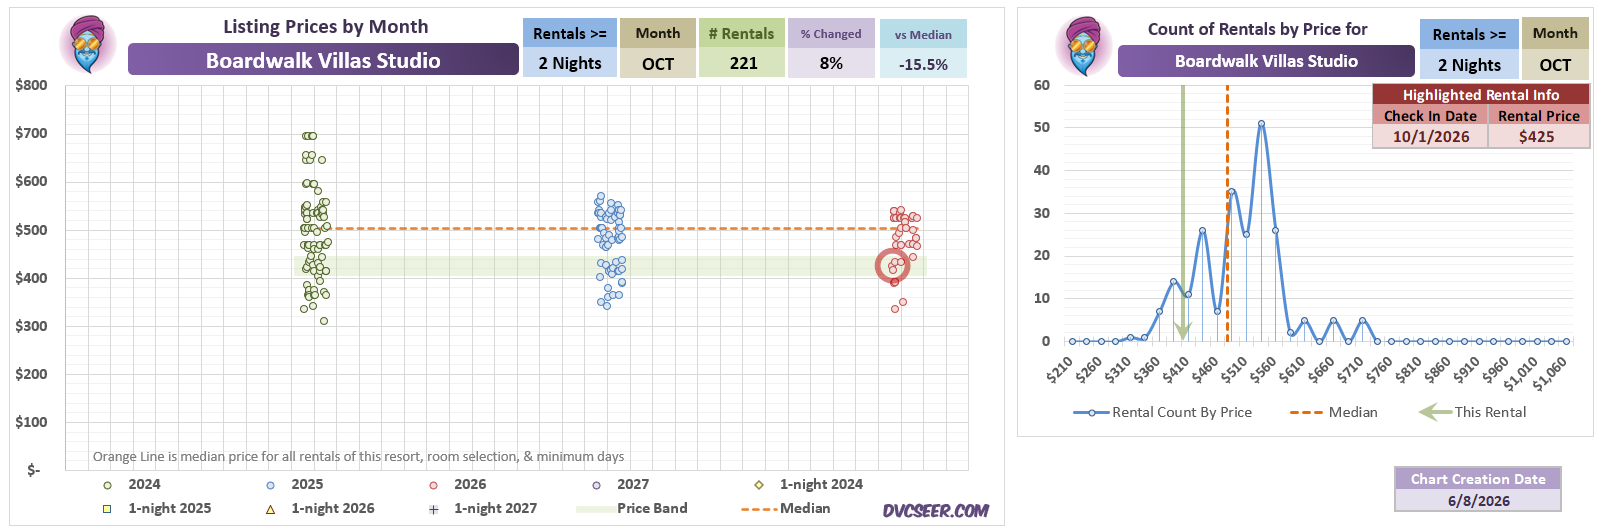
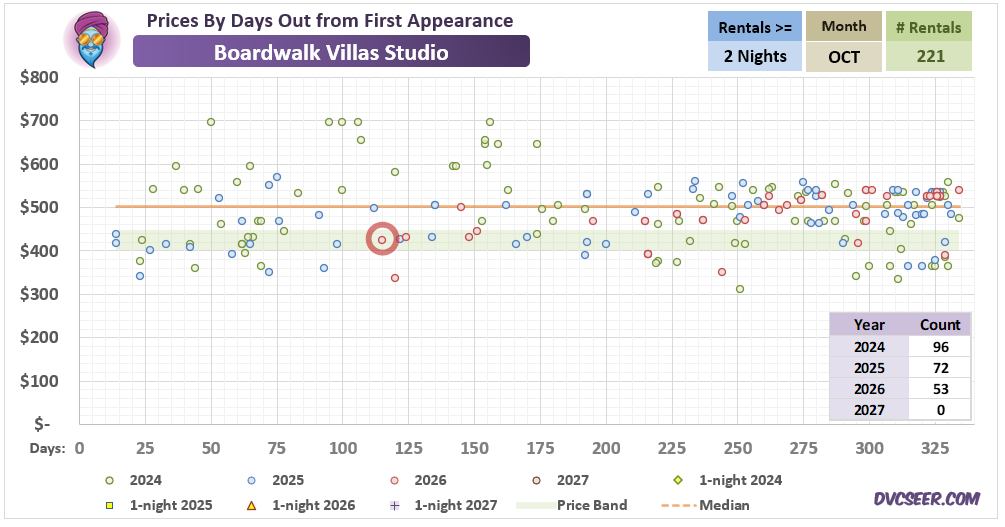
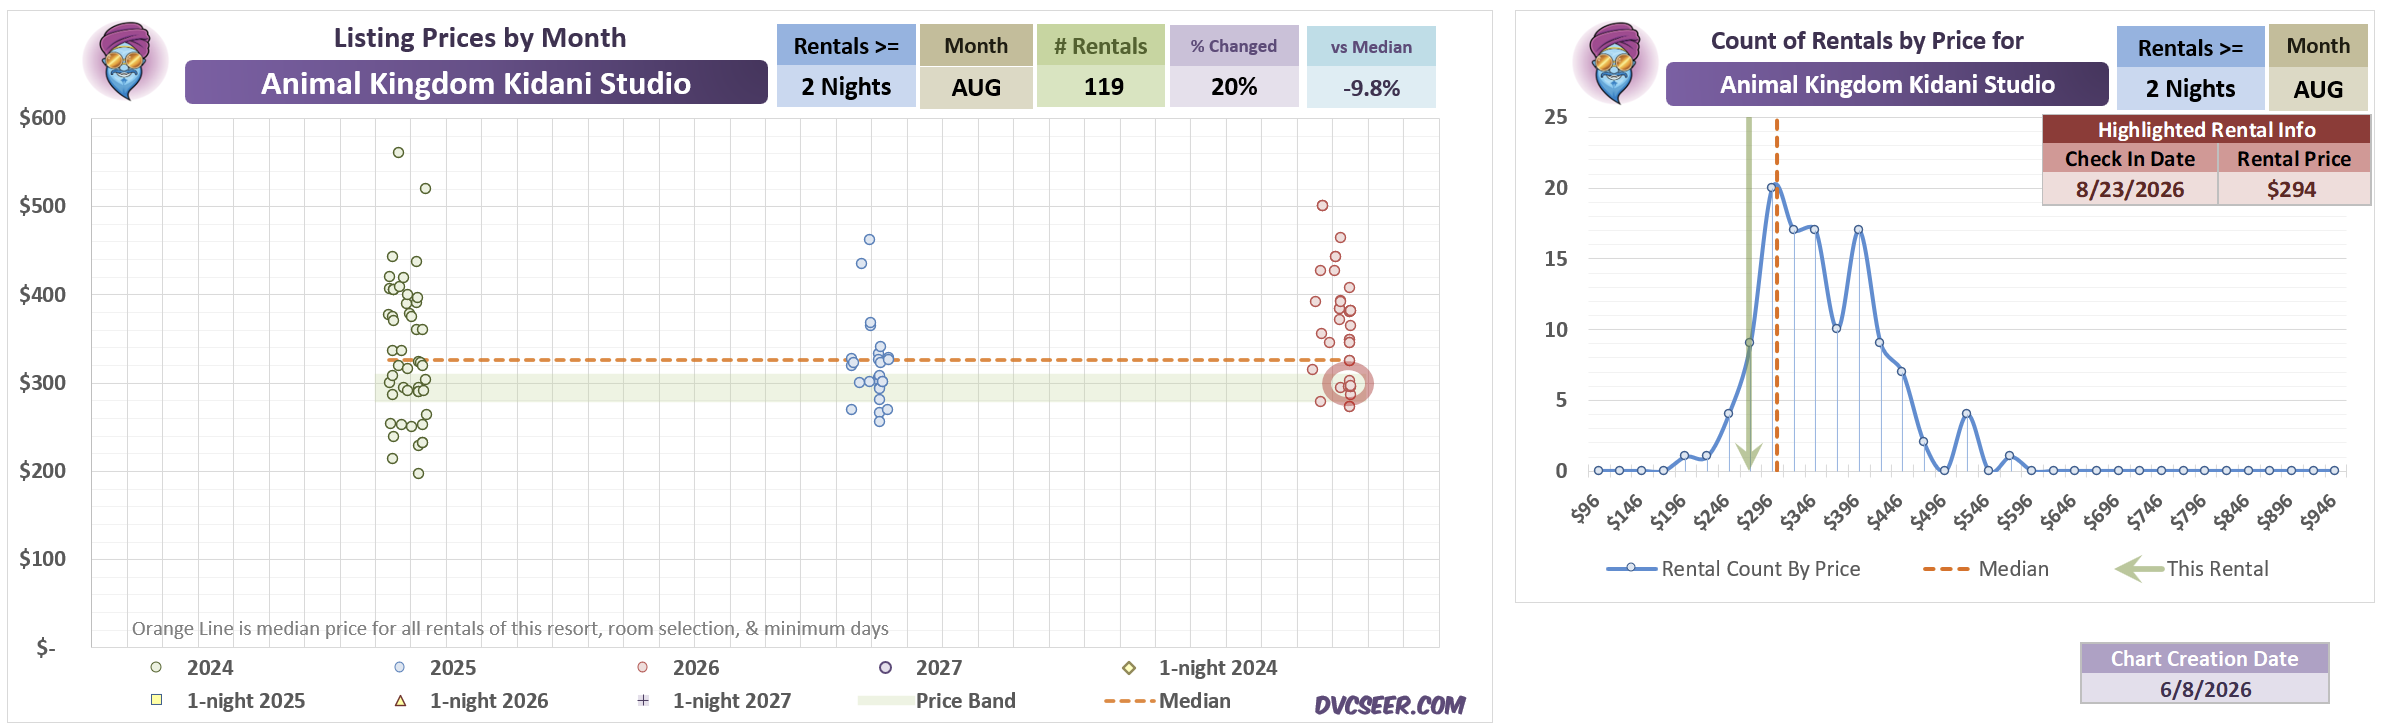
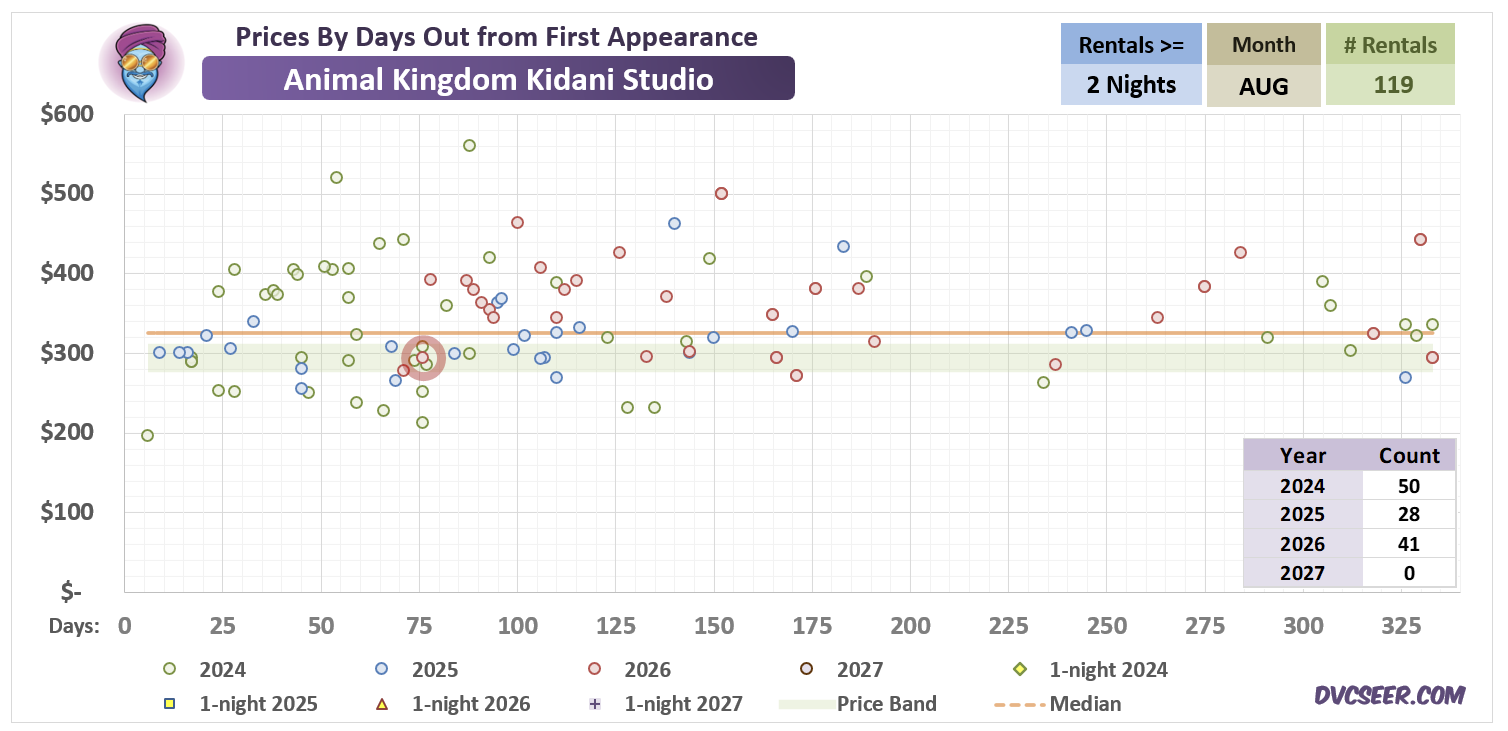
Not the lowest Boardwalk price recorded, but a very respectable deal!
Good chance we’ll see at least a few more at this price or below as October approaches.
3-night Boardwalk Villas Studio 10/01 for $425/night or 12% under median
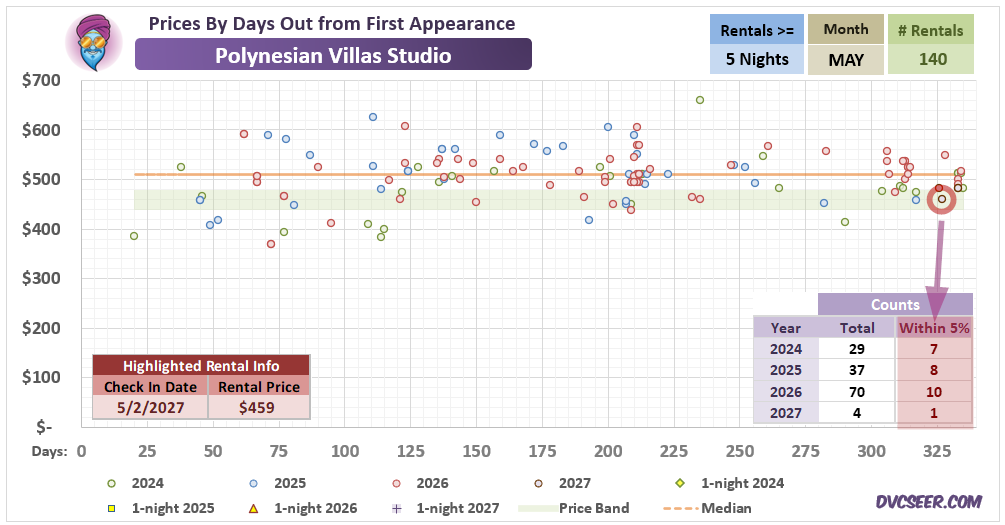
UPDATED This one with new 5% Price Banding Counts - see charts at bottom.
An argument for booking an “only” 10% under median listing 11 months out: even with a bump in the number of longer listings this year, just not that many 5-nights or longer appearing within the same range as this $459 price!
(…and now I’m writing a formula to show me how many listings each year are within 5% above/below the price of the highlighted listing in my sheet. Having some weird issue with my sumproduct formula and the year() function combo though.)
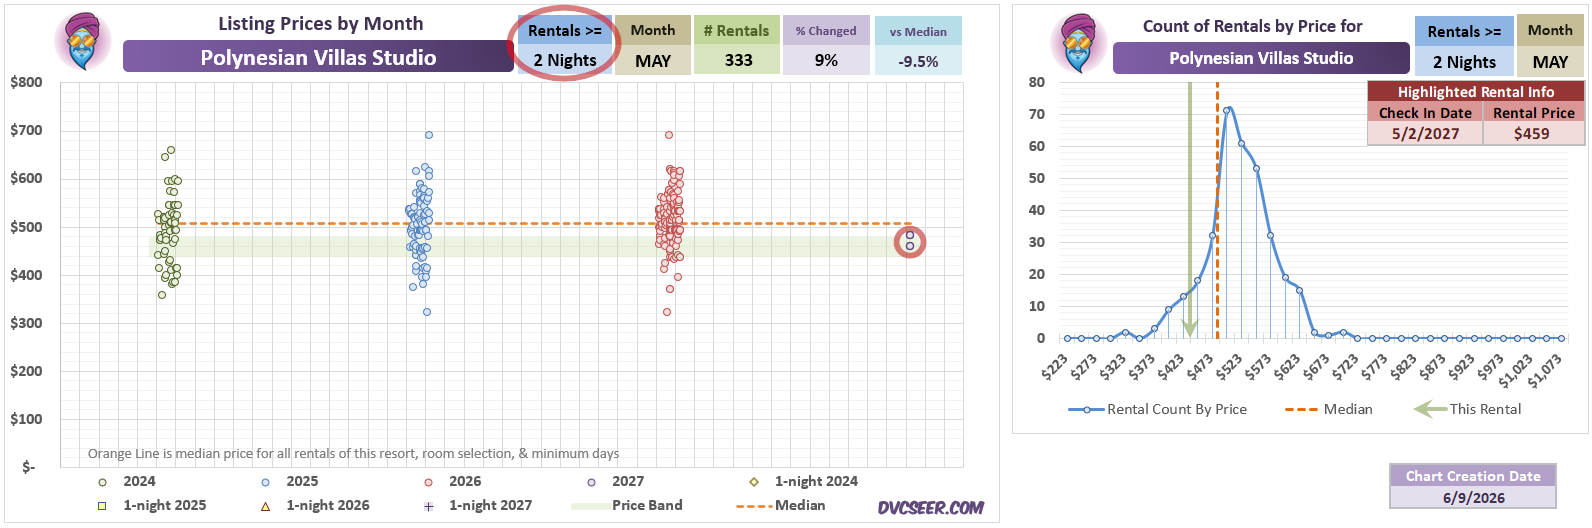
5-night Polynesian Villas Studio 05/02 for $459/night or 10% under median
Added later:
I’ve added another column to the counts table I sometimes include on the bottom right. Does make the chart a little busy, so probably won’t include all the time but do think the count adds some value.
Total column in that table counts the number of listings for this Resort/ Room Type / Month and minimum number of nights entered for each year.
Within 5% column filters that count down to just the number of listings that were within 5% of the highlighted listing price.
So, in this instance, when looking at 2-nights or longer there were 162 Poly studios in May 2026 and 24 of them were within the $459 listing price of this deal.
When limiting to 5-nights or longer there were only 70 listings in total and only 10 of those were within 5% of that price.
Helps give a better picture than the dots on charts alone since some rental sites LOVE to list multiple duplicate listings at the same price and start dates.
…AND I’ve already rethought that “Within” column: I’ve changed it to count any listings that are 105% or LOWER than the highlighted listing.
If there happened to be a bunch of listings more than 5% cheaper than the current one, I kind of want to know that when trying to decide whether it might be better to book this one or wait.
Also, that 5% is changeable in my chart generation sheet, but for now I think making the comparison ceiling 5% above the listing is a decent place to go with.
Next listing in the thread should have the new table.