I picked a random date similar to what they used in the video. There are long wait times for Primeval Whirl, Triceratops Spin, and Adventure Outpost, beyond the “top 6”. (Granted, PW is no longer a thing…but it was for the date the model was based on.)
BUT, in order for it to be the “average standby” time, it means the average person is waiting in the average line. The wait time in standby means there are actual people in the line, you know…waiting!
Yes but that’s the average standby time per attraction over the course of the day. If I arrive at 11 and leave at 6, I’m going to be waiting longer than if I arrive at rope drop. And more people wait at attractions at their peaks (definition of peak).
All of that was factored into their model when they did these calculations. So that is the AVERAGE wait per ride for the average person across all attractions.
Right, but the average wait per ride for the average person is different than the average standby time. @len Can you shed a little clarity on that graph?
I am not 100% sure but I was thinking the “average standby” is a simple average of wait times, whereas the “average overall wait” was a weighted average based on the rides people actually waited for, which is higher since more people wait for the popular rides. But I could be wrong.
You are correct. But again, when there is just a standby line, it comes to the same end. It is when you start throwing in FPs that things become more…fuzzy.
I would argue it could get worse than the FPP system.
1.) Higher marketing and more in your face (part of the MDE) with Genie + than FPP. This will lead to more people using it than ever used FPP.
2.) The price point is low enough that most people will fork over the $15. We are already seeing the majority of people on these forums using it.
3.) The fear of missing out on attractions is already having people purchase Genie+ when it is not really needed in the park. This will only get worse.
4.) Having the ability to book attractions all day long will have people booking more than the QTY 3 that most used in FPP. In the past I bet most did not know that could book a 4th, 5th, etc…
Hypothetical: If there is a 5 minute wait for the first two hours of the day but only 10% of guests are present at that time, and 90% of the guests arrive 2 hrs into the day, that’s going to skew average standby time vs average time in line for most guests.
The language used in the video makes it sound like they calculated “average standby wait” for each guest. But regardless, it still comes to the same end. The first two hours will be “skewed” just as much by the fact that 90% of the guests are riding during the rest of the day.
I’m skeptical because a lot of guests are APs and don’t want / need to use Genie, and because $15 per person isn’t much for some, but it’s a lot for guests on a budget.
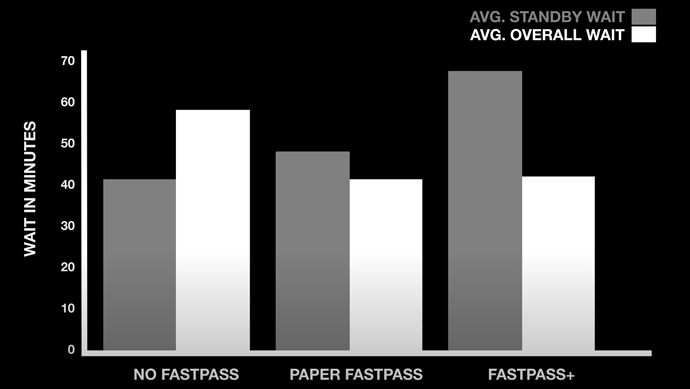
When there was no fastpass, more visitors (proportion) went for the most popular rides, and the less popular rides had no waits (actually negative) because more people would totally skip them and they were not filling to capacity. That is why the avg. overall wait was longer back in the day.
In the FP+ era, the avg. standby wait (gray) was higher, but the avg. overall wait (white) was much lower. Of course, since most visitors utilized some amount of FP+ (short wait queue), the avg. overall wait will almost always be lower than avg. standby wait.
Adding FP+, encouraged visitors to ride these less popular attractions because of making that second queue reservation available. So even though those less popular attractions had zero waits and really didn’t need a FP+ queue, adding that FP+ (which is a draw) gives visitors the impression that there really is a standby wait, AND some people had to settle for those because the headliner FP+ was gone.
That’s what I’m coming up with too
Pre-FP, most visitors leaned heavily towards the popular rides and didn’t experience the short waits on the unpopular rides. FP+ era changed that for the good, and flipped the 2 categories.
I think your interpretation of the data is correct.
However one important caveat is the later chart that showed the huge disparity in the “average” - some guests were riding 10+ rides while the “median” guest was riding less than 3.
Adding: Ah right, because the distribution is not even and the system is not fair to all guests. Plus, guests who would still choose to wait in a high SB line do not have the time to experience that extra attraction in the day.
Even though I don’t like the monster that was created, having secondary queues available disburses people so much better and forces them to experience more unpopular attractions when they normally would not. Otherwise, those handful of attractions would have a negative wait (not filling to capacity).
It’s also worth keeping in mind that this is a simulation - and,.l as is the case with any simulation, is only as good as its assumptions. This may or may not be representative of what FP actually does - change one variable and the whole model mat change. It is also possible that the author’s biases crept in to lean towards a particular outcome (not intentionally, just that biases often creep into modeling).
That’s not to discount the value of this work - just to keep it in perspective.