I worked in Operations Research and appreciate Len Testa’s optimization. But we must understand the data to accommodate delays, ride closures, and Lightning Lanes.
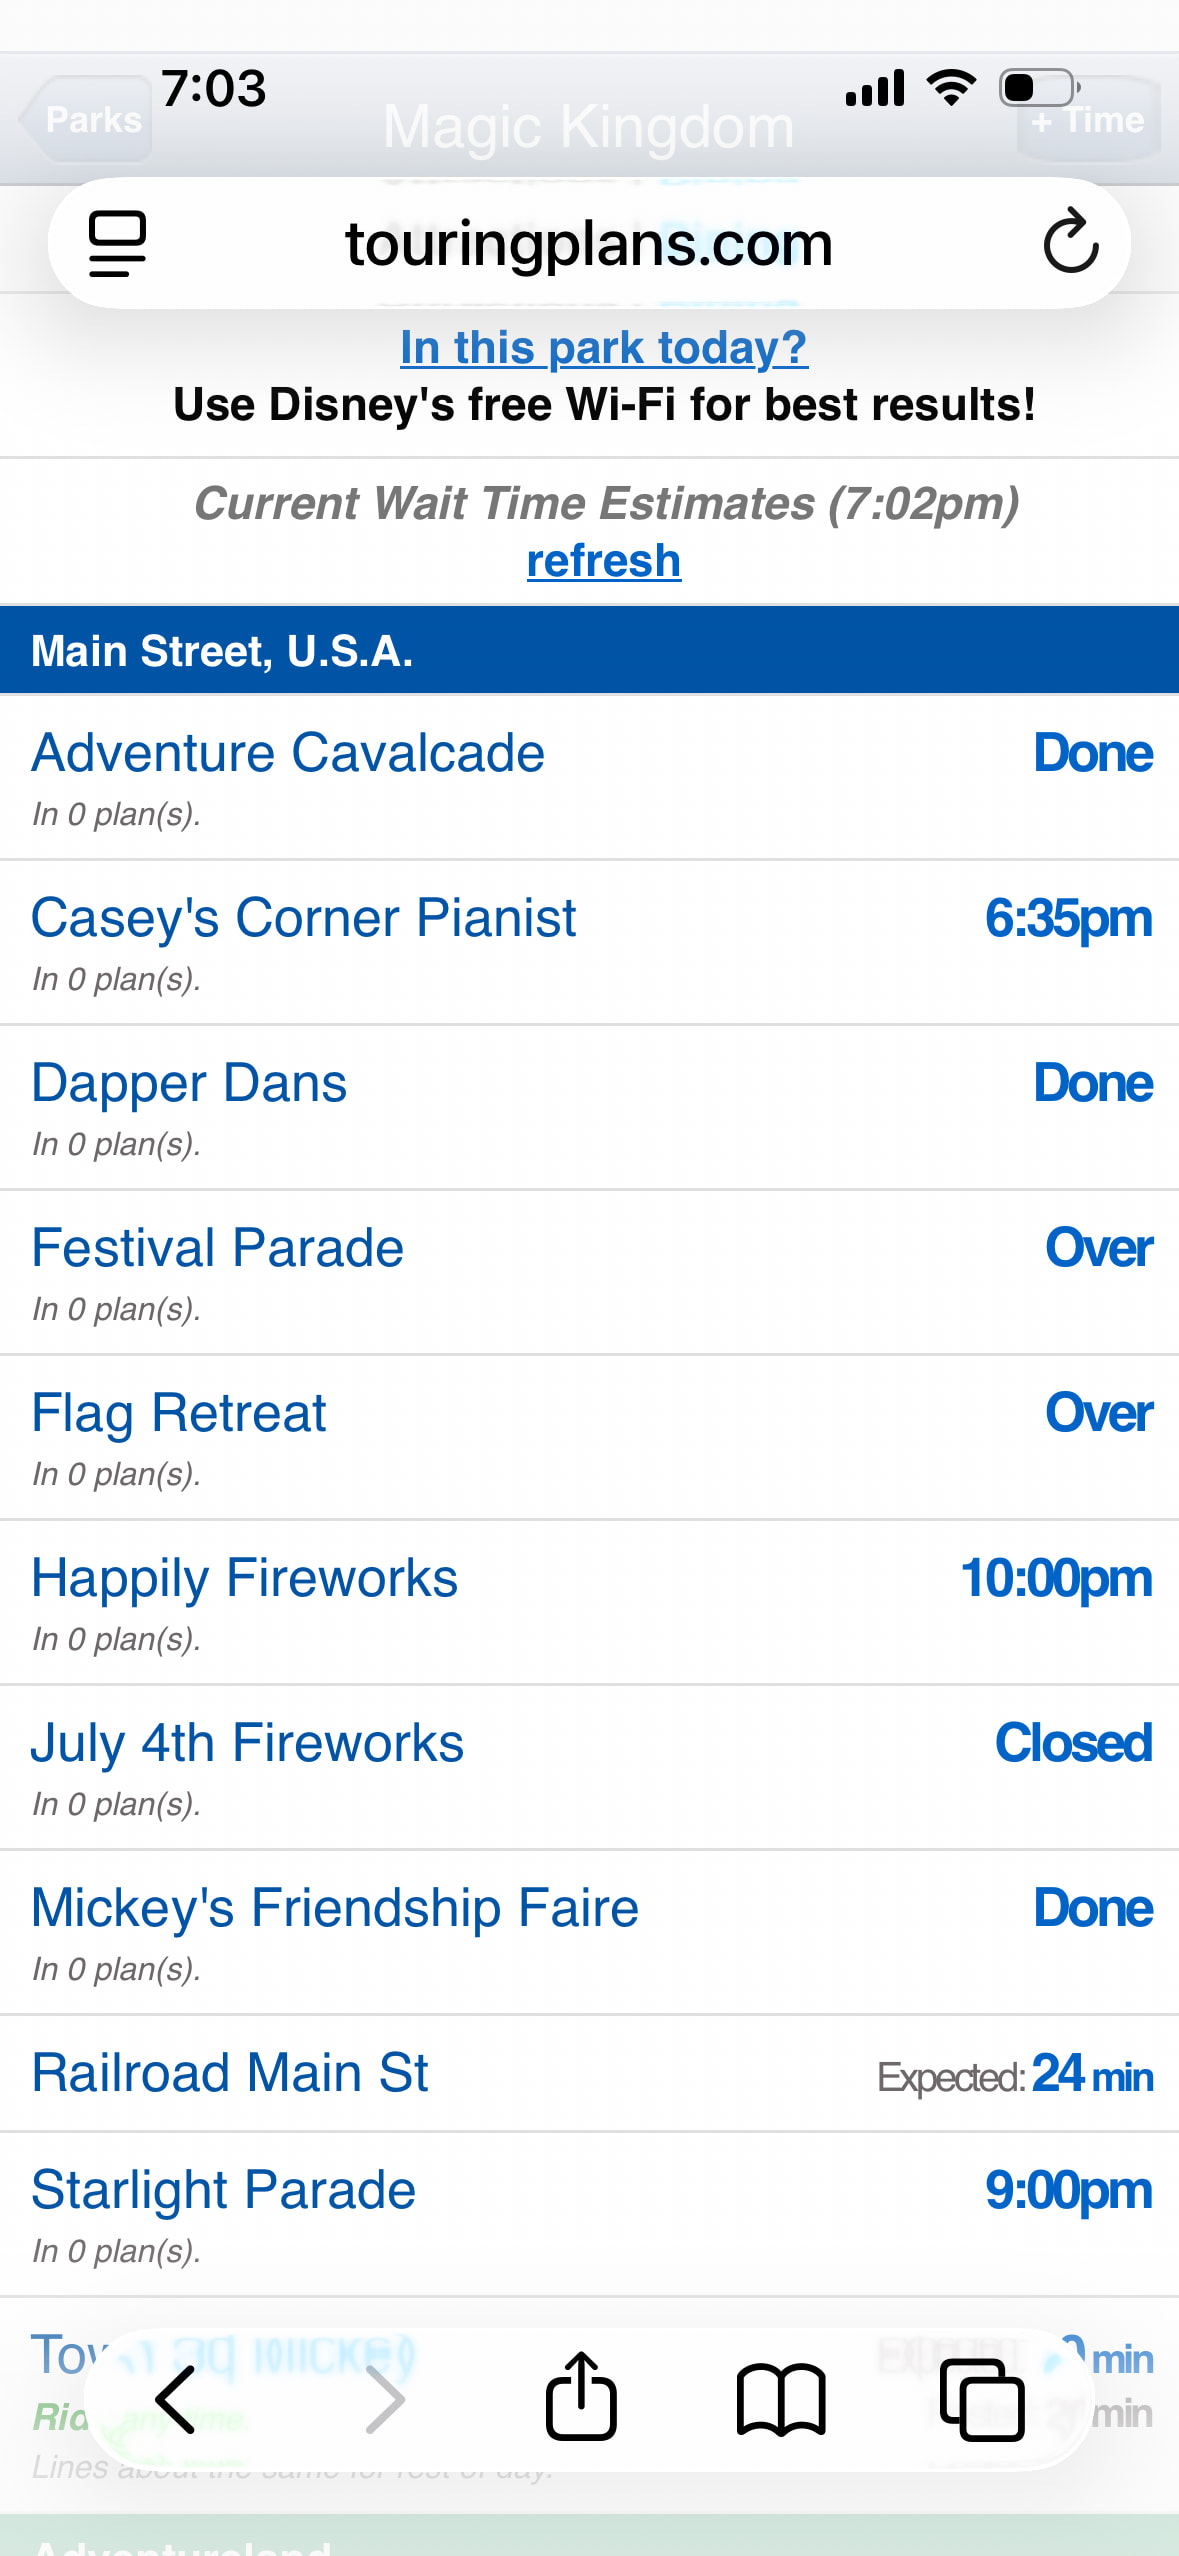
I need a single table listing attractions in each area of the parks, ratings, wait times, and Lightning Lane eligibility. Currently, I make a spreadsheet and sort it myself. Suddenly, the touring plans make sense. We use Lightning Lane or rope-drop the longest lines (Peter Pan), clump nearby rides together (Fantasy Land separate from Adventure Land, then grab the short lines and wait for the longest lines to subside at the end. This is more helpful than a long optimized list from a black box.
Are you asking a question, or sharing something you’ve done with the material beyond the existing tools?
I love the TPs. I just tell them what I want to ride and see and ~voila~ I am told where to go and when to go. With so much on my shoulders, I love not having to sort through the data and make a plan myself. I can’t do anything about ride downtimes, of course, but the re-optimizing live in the park helps make the best of the detour.
This would be awesome. The folks I’m typically in the parks with are increasingly interested in fewer steps. Add the warmer weather and perfect recipe for less touring.
With the loss of the old heat maps and unsorted touring plans as you described, I’ve not even renewed my WDW subscription to TP tho I’ve no trip on the horizon either.
Your single table idea is inspired, imo. I’m a ride clumper from way back, tho not so much of late. Life changes and all that.
I’m Original Poster requesting/venting/sharing. Sorry, but Len’s Unofficial Guide’s terribly organized and 700+ pages too long! It has too many unmerged charts with disjoint data.
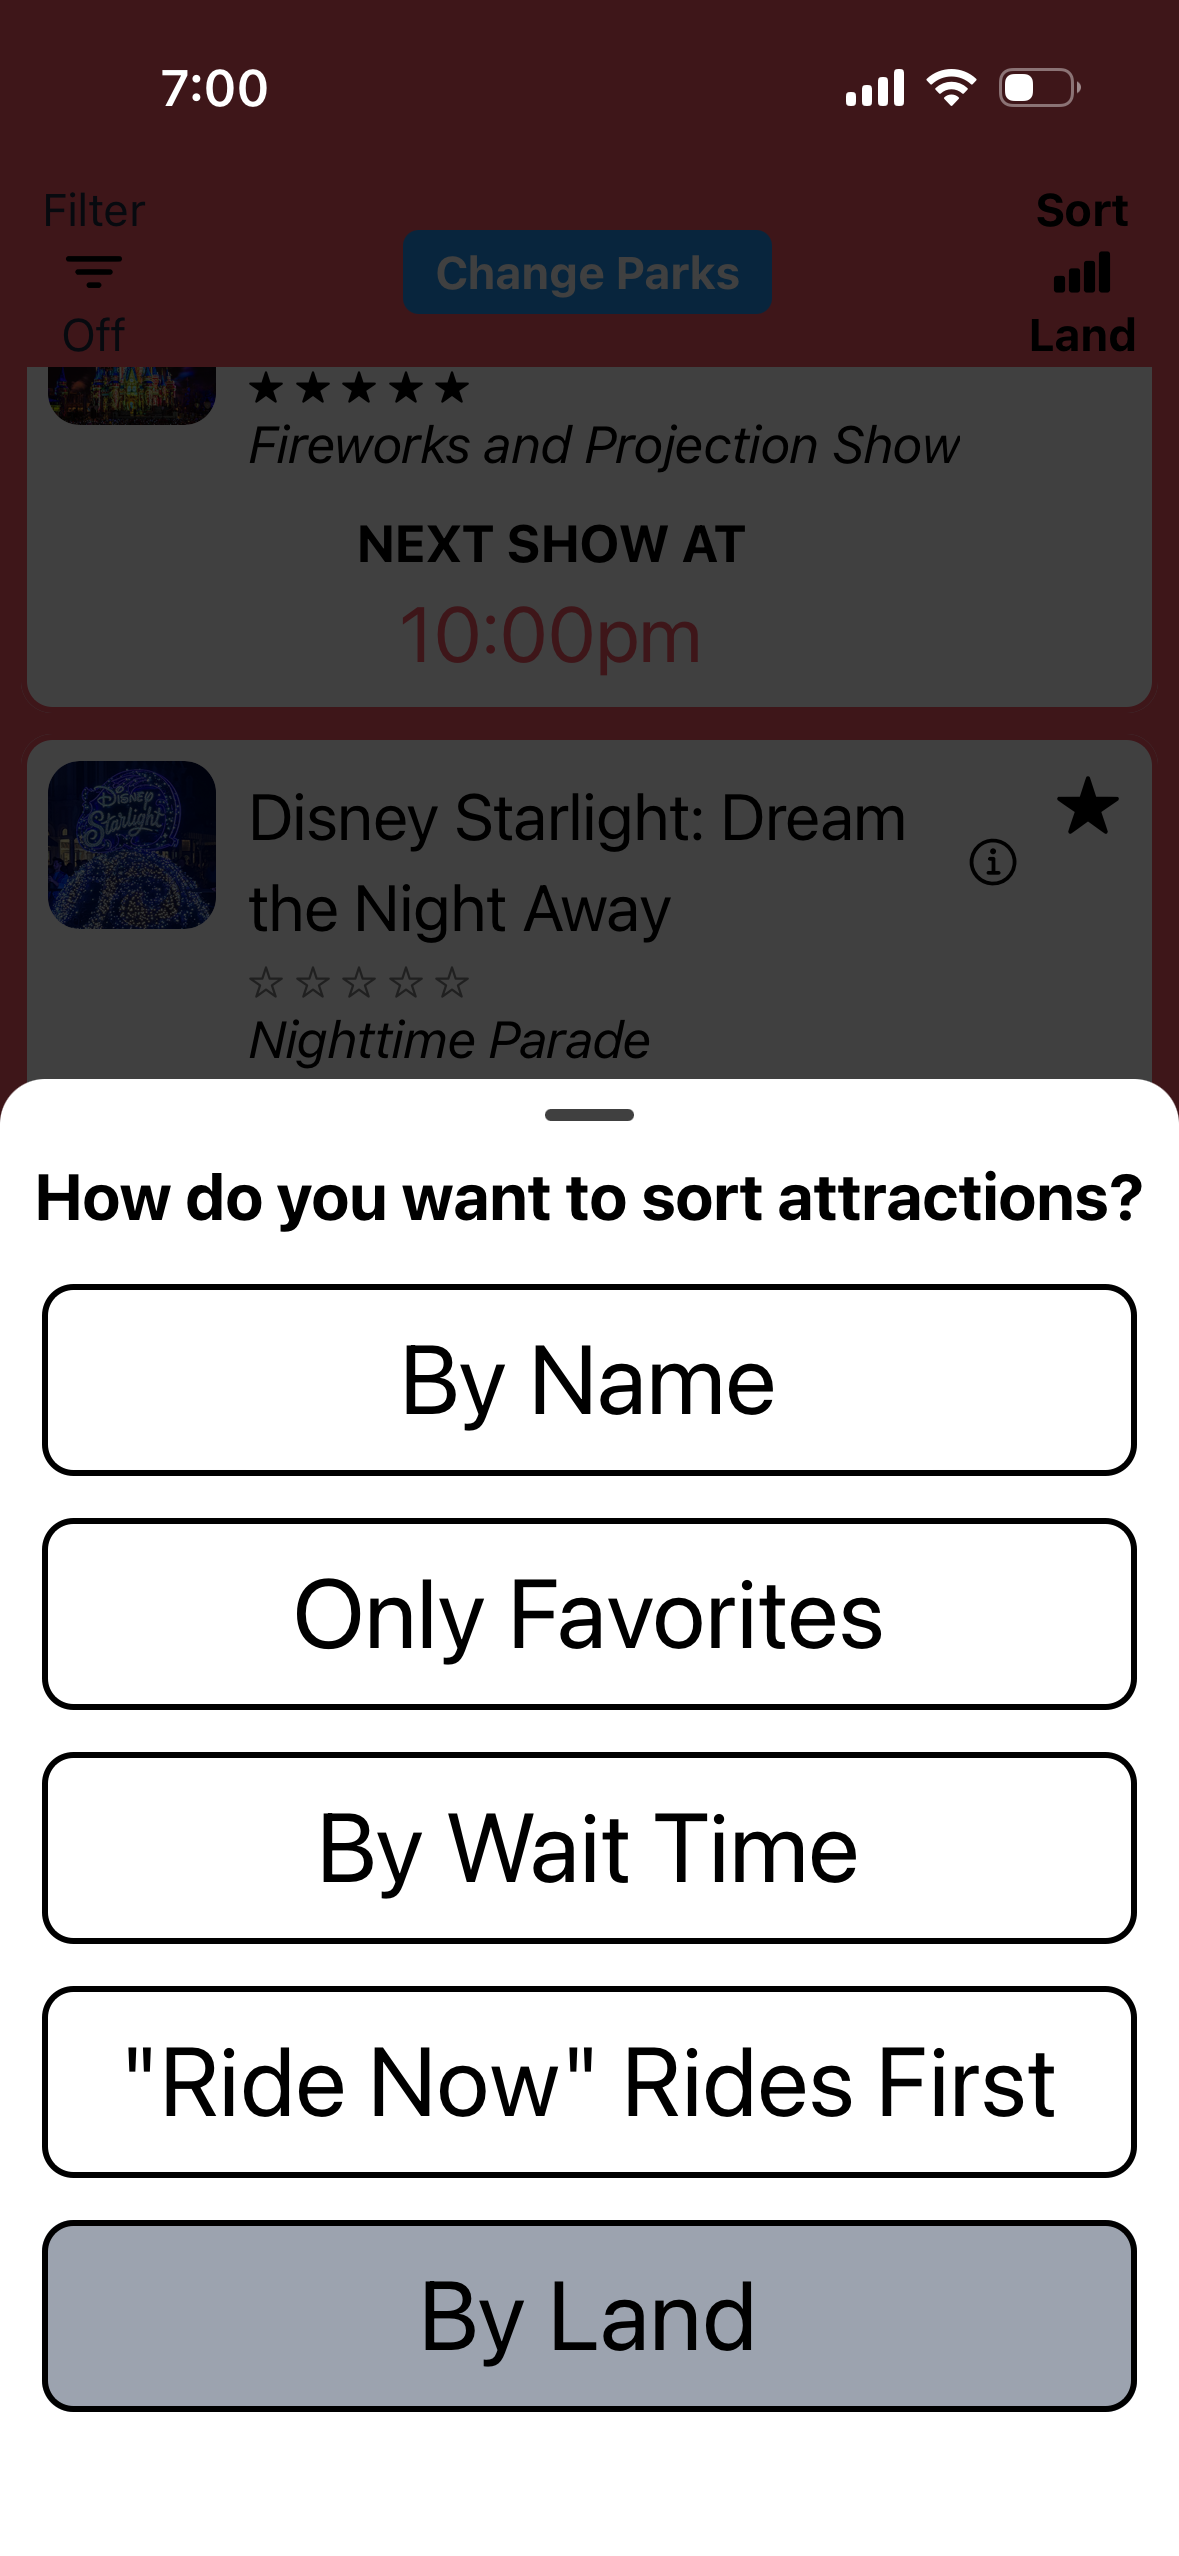
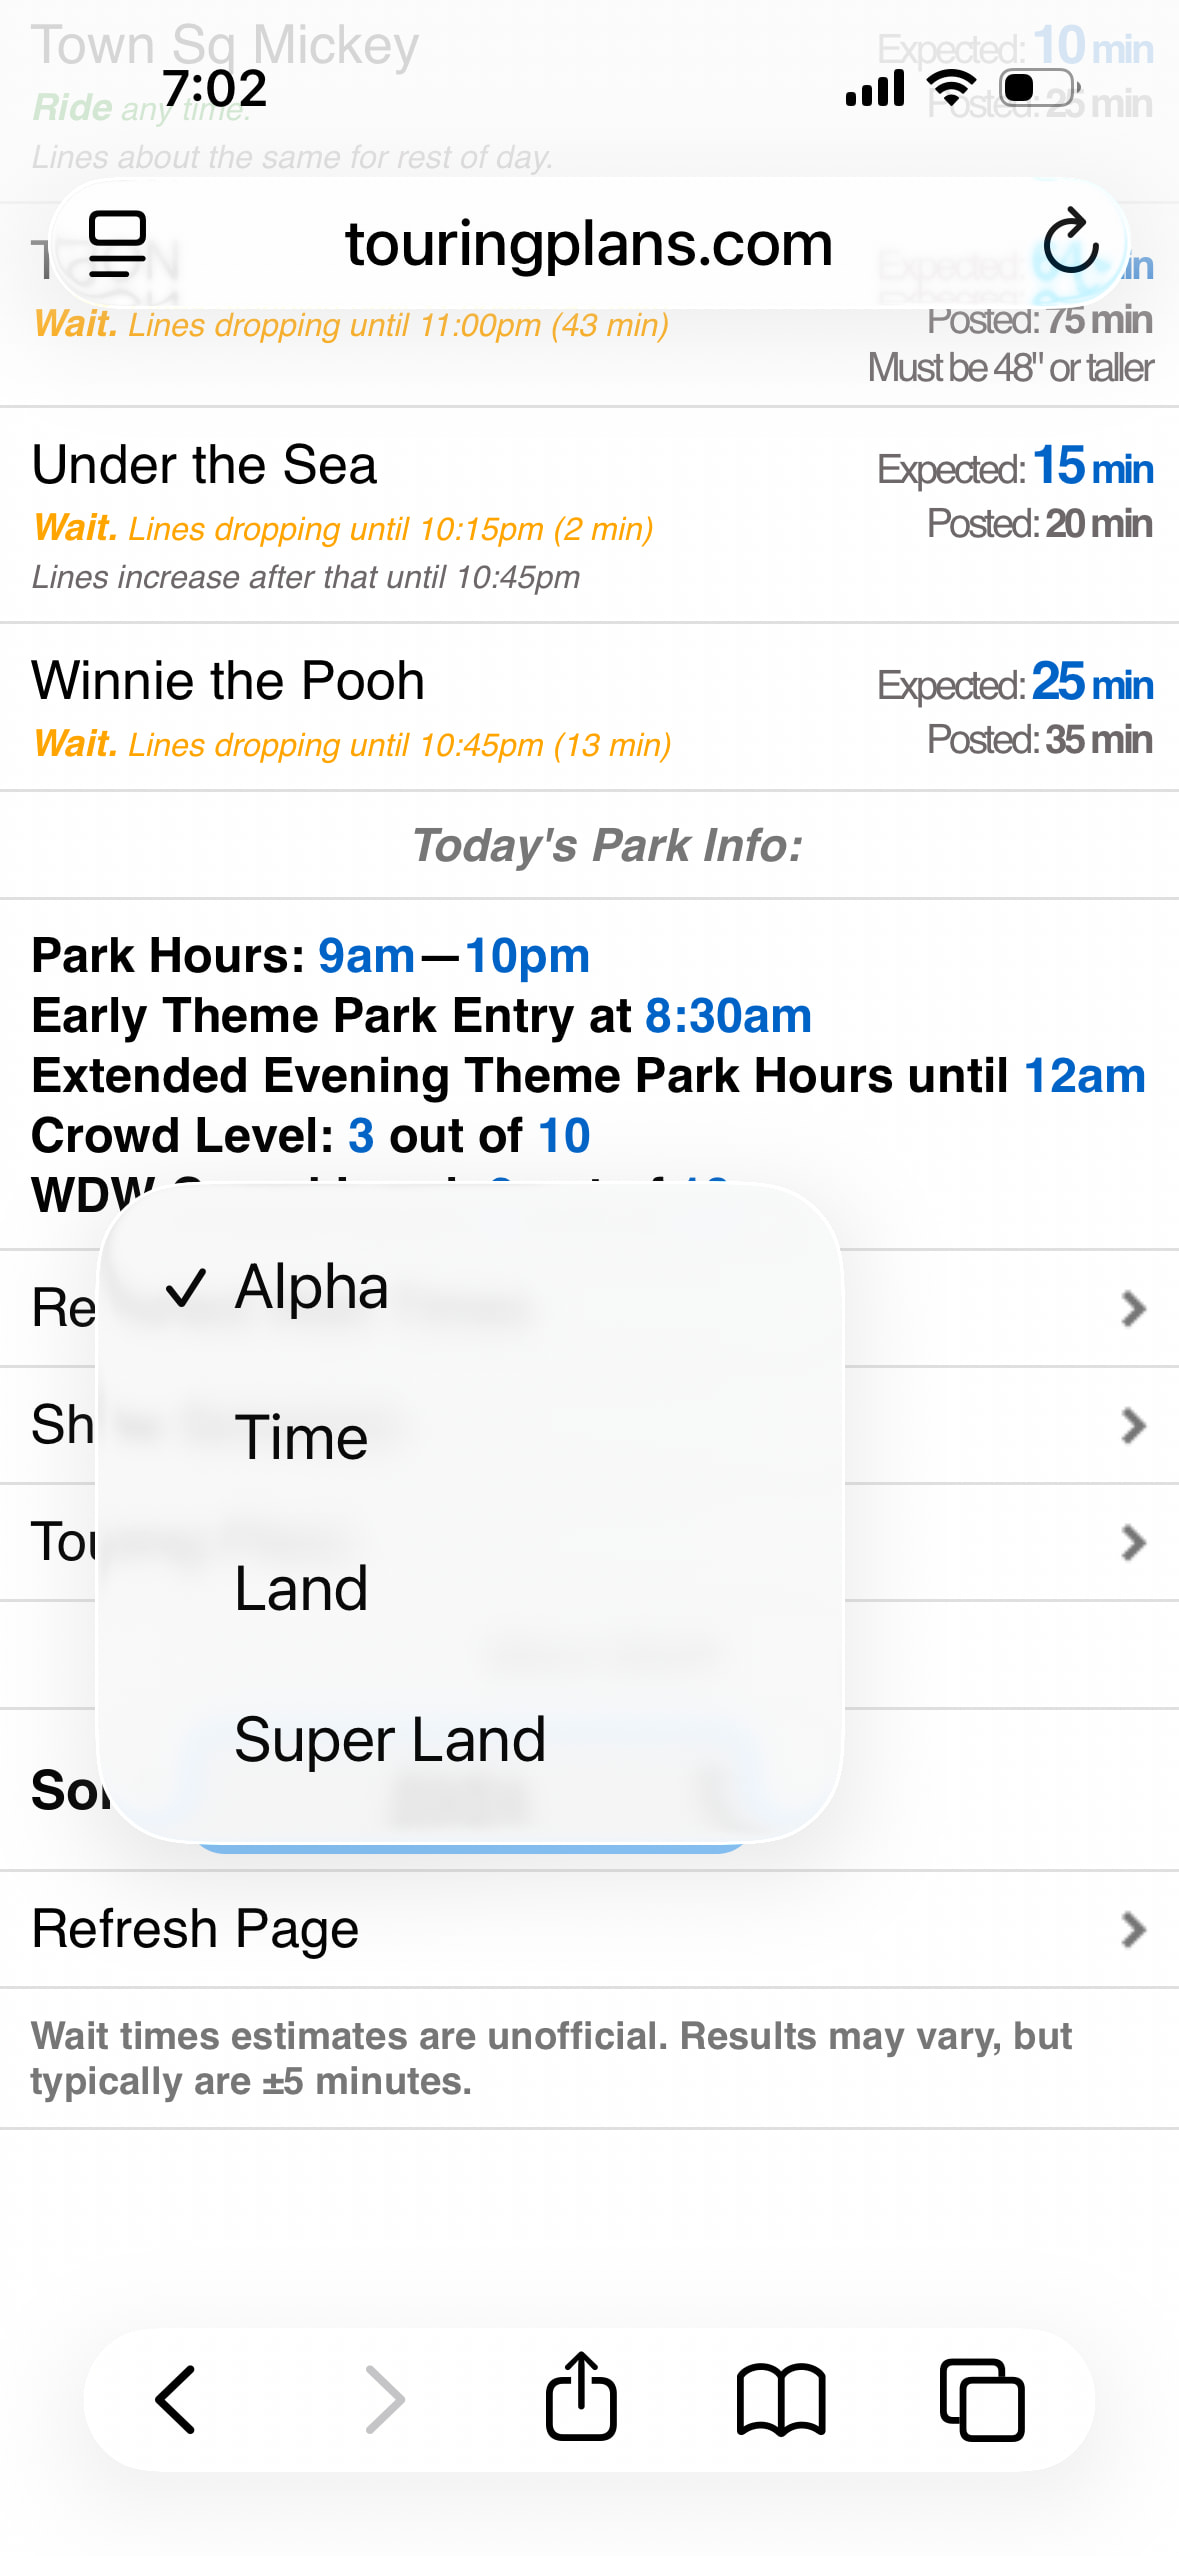
I currently sort attractions by pre-school rating and parse into a spreadsheet It is quicker to just copy lists from touring plans in the book and website. I manually enter the location, Lightning Lane, height restrictions, and wait times. We could crowd-source all this.
For planning, I delete scary rides with height restrictions, buy one Individual Lightning Lane, and rope-drop a popular ride. Then prioritize in each land. I skip long waits (Peter Pan, Toy Story) and substitute short lines for Small World, Carousel, Tea Cups, and Dumbo. I also book character meals and opportunistically meet characters in the parks.
I read strategies like “burner rides” to recycle your Lightning Lanes. But this information changes quickly. Merged data tables will be valuable for a long time.
We’re always interested in making the data more useful. If you can, post here a screencap of what your spreadsheet looks like. The most helpful feedback we get often contains examples of what to do.
Yes, I would like those tables that merge data from multiple exhibits. Ideally this would be a software product that lets me sort, like my spreadsheet. Or it would be data that I could copy-paste from your website.
A paperback book could present the data sorted by different age categories (just like your touring plans have different age targets). Think about new Disney visitors. We need to triage the rides. Take the top 10-20 for our age group, eliminate based on height or preferences, and then plan our priorities. If we have a rough idea then we can watch some YouTube videos, use park maps, and form a flexible plan. I threw out Spiderman rides and added Princess meetups for my girls. I skip rides due to closures, rain, or long lines. These tables would let me do this by narrowing down 60-80 attractions. By contrast, touring plans can be opaque black boxes that lack flexibility.
Let me illustrate with my preschool twin girls at CA. Take top 24 attractions and eliminate 42" and Spiderman rides. Early entry is gone, but Disney hotel guests get one free Lightning Lane pass. Radiator Springs has a 2-hour line and seems like a no-brainer for Individual Lightning Lane. But it is #17 on attractions for preschoolers, so it is pretty marginal. Toy Story has a 45-minute line and my kids did not love it at Hollywood Studios. So I might skip it to get more rides with short lines. It might depend on the line and my kids’ mood.
The book touring plan visits Paradise Gardens in the morning and Cars Land in the afternoon, and the blog plan vice versa. Also, the blog forgot about the Redwook Creek Trail, not a ride, but the #5 attraction for preschoolers. The order of Paradise Gardens versus Cars land depends on the time assigned for Radiator Springs (in Car Land) and my other Lightning Lane.
The moral is that a book or website cannot anticipate all these contingencies. Optimal paths can sensitive to small details. But it is better to have a suboptimal plan than no plan! The touring plans are just tools.
I’m starting with your plans and modifying for my situation. Official touring plans could accompany a chart with attraction ranks, locations, wait times, and Lightning Lane eligibility. This would make the plans easier to understand and modify.
The restaurant tables are great, with cuisine, name, location, quality, and price. I need dinner at my hotel and lunch in Disneyland. Napa Rose has 5-stars and Cafe Orleans 3.5 stars. That was really useful, easy, and flexible if priorities change.
To make analogous tables for rides, I copied attractions from the Disneyland touring plans for one-day and late arrival with small children. Strangely, they did not completely overlap. I double-checked against top pre-school attractions, then deleted a few scary rides. Almost everything was in Fantasyland, Toon Town, or Tomorrowland. Lunch in New Orleans Square is near Pirates of the Caribbean and Jungle Cruise, so we might try those with the lunch detour.
Peter Pan has long lines and my kids don’t care about London, pirates, crocodiles, or Native Americans. So we will probably skip it and anything with lines over 25 minutes. My kids would prefer more time in Mickey and Minnie’s houses and Goofy’s Play Yard. FYI, the top-ranked attraction for preschoolers is King Arthur’s Carousel at 4.7/5 stars. The hotel pool would probably get 5/5 stars.
The point is that an optimized touring plan would not know where we want lunch or other preferences. By using my tables, I can flexibly modify the official touring plans without much work.