Which has me getting to ToT at exactly the same time as two week old plan with 9 open which is mildly interesting. All this does go to show though its easy to not realise the expected checking and updating that have to be done manually to get it ‘right’
I re-did the WDW and UOR wait-time models over the weekend, and loaded new forecasts to staging. That went well.
That’s imporant because the loading process has built-in sanity checks, and will fail if it sees obvious problems.
Then I re-tested all of the standard one-day touring plans (AK, EP, HS, MK, EU, IOA, UF) for “rope drop”.
All of those plans look good.
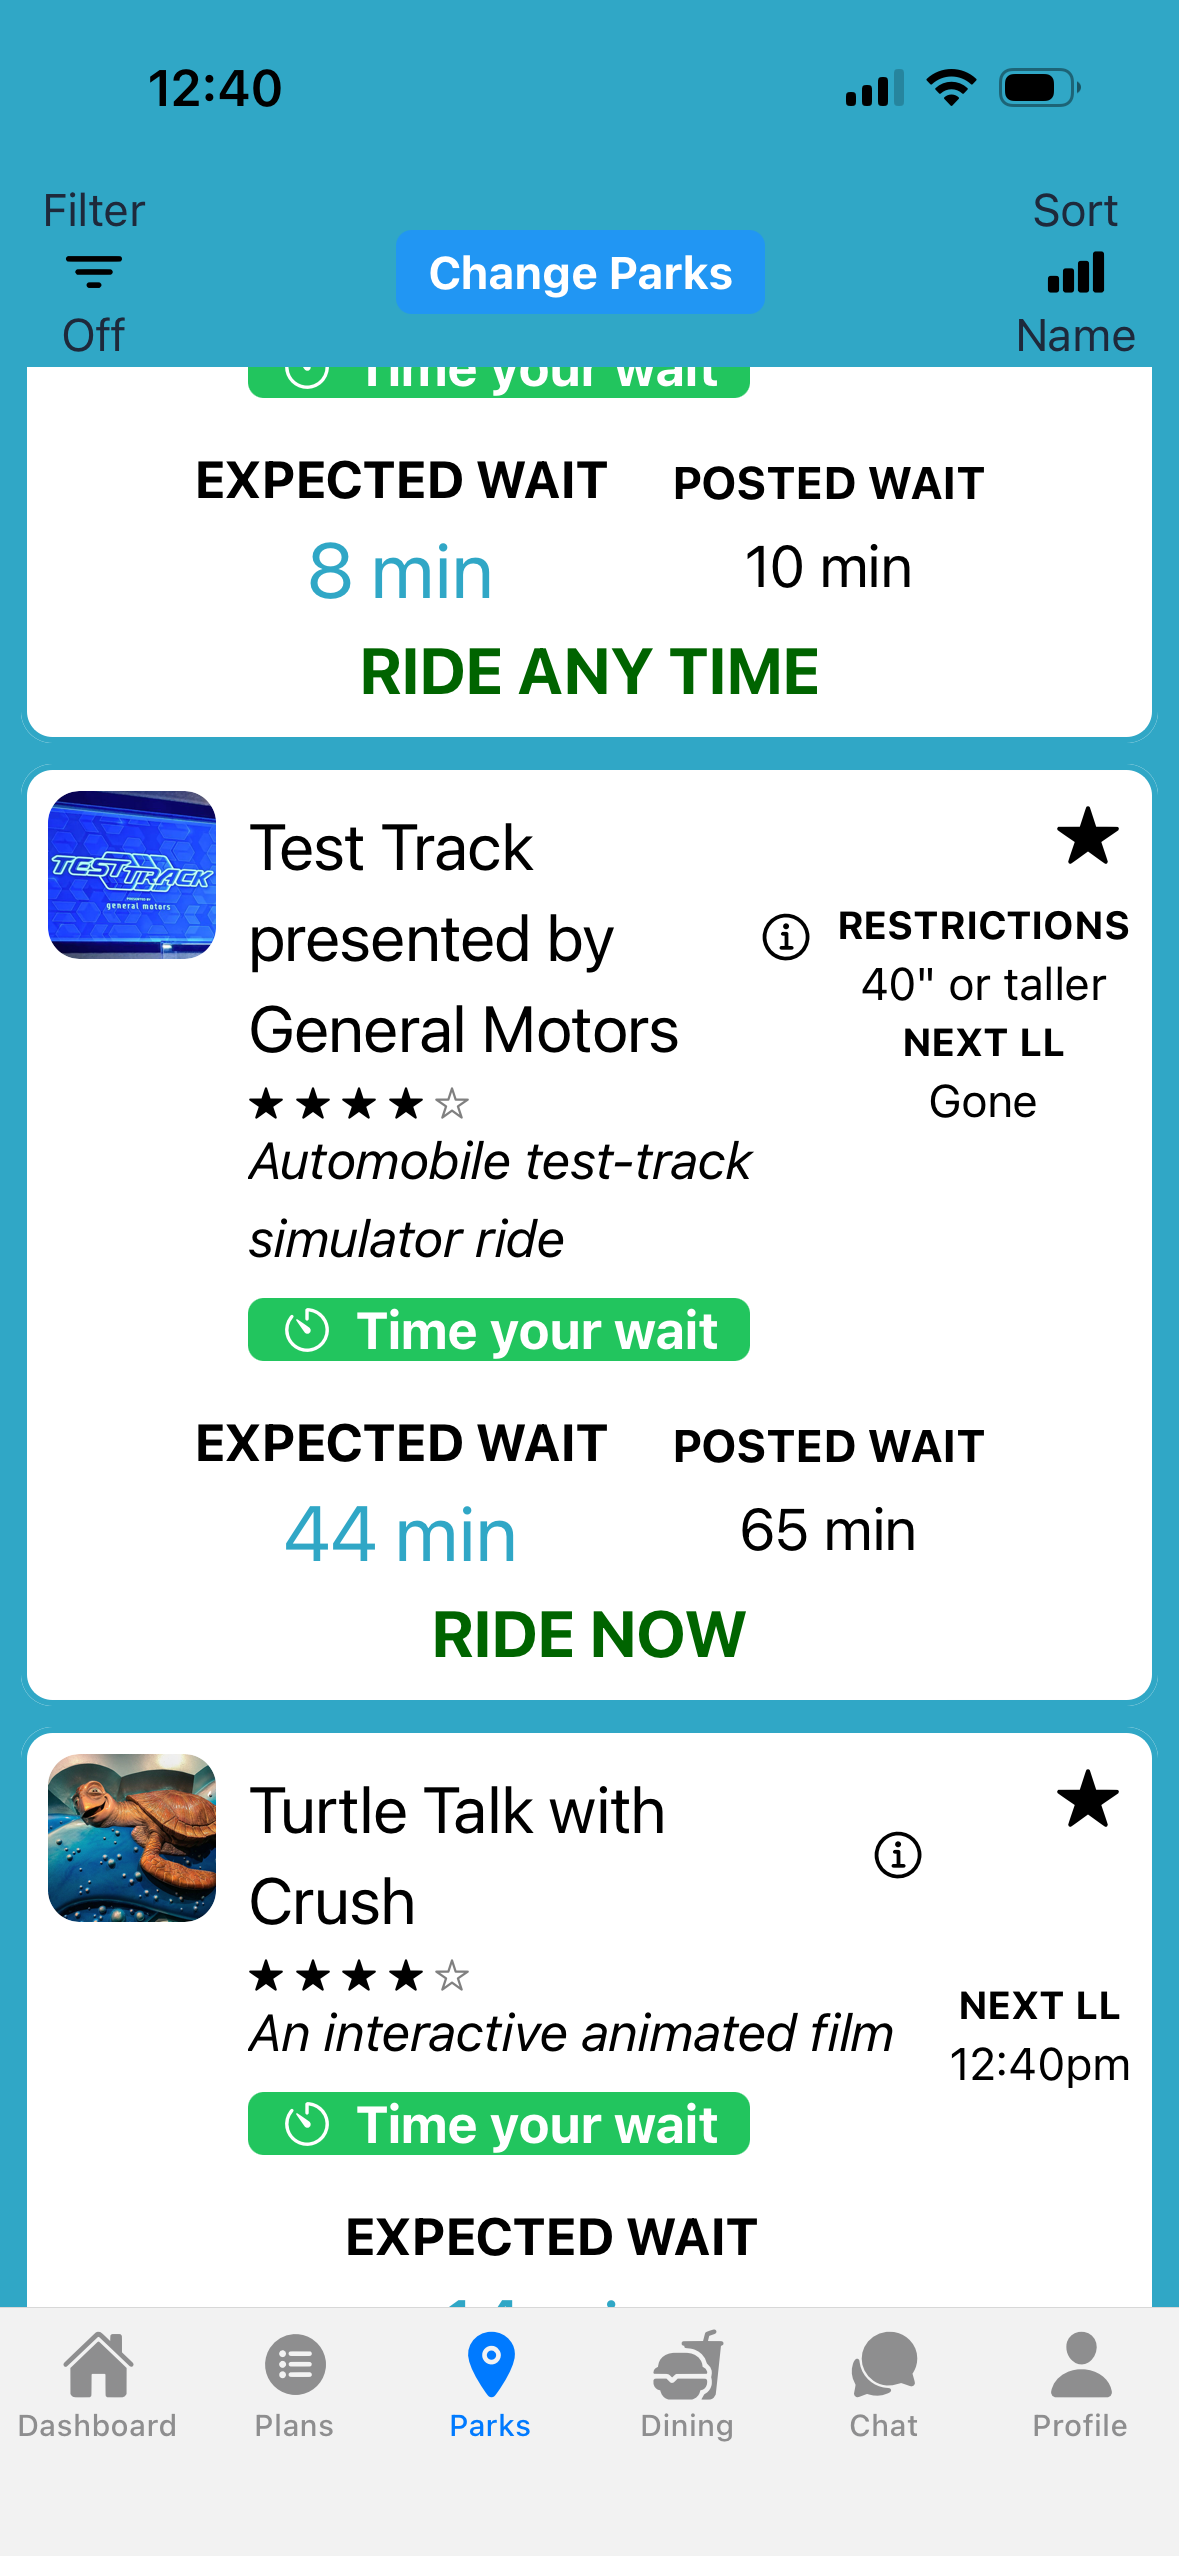
I was expecting the plans to have the same initial sequence as before (e.g., Slinky Dog Dash as Step 1), and all of them do. Except EPCOT.
The new one-day EPCOT plan has Test Track, not Guardians, as Step 1. I suspect this is because Test Track is updated, and less reliable than GOTG. Step 2 remains Soarin’.
My next step is to see how the new intraday adjustment process worked yesterday. That’s my task for the rest of today.
Assuming that goes well, we should be able to load these new models and intraday process by this Thursday. So folks going to WDW and UOR for the holidays should have the most accurate models possible. (And then I’ll work on DLR.)
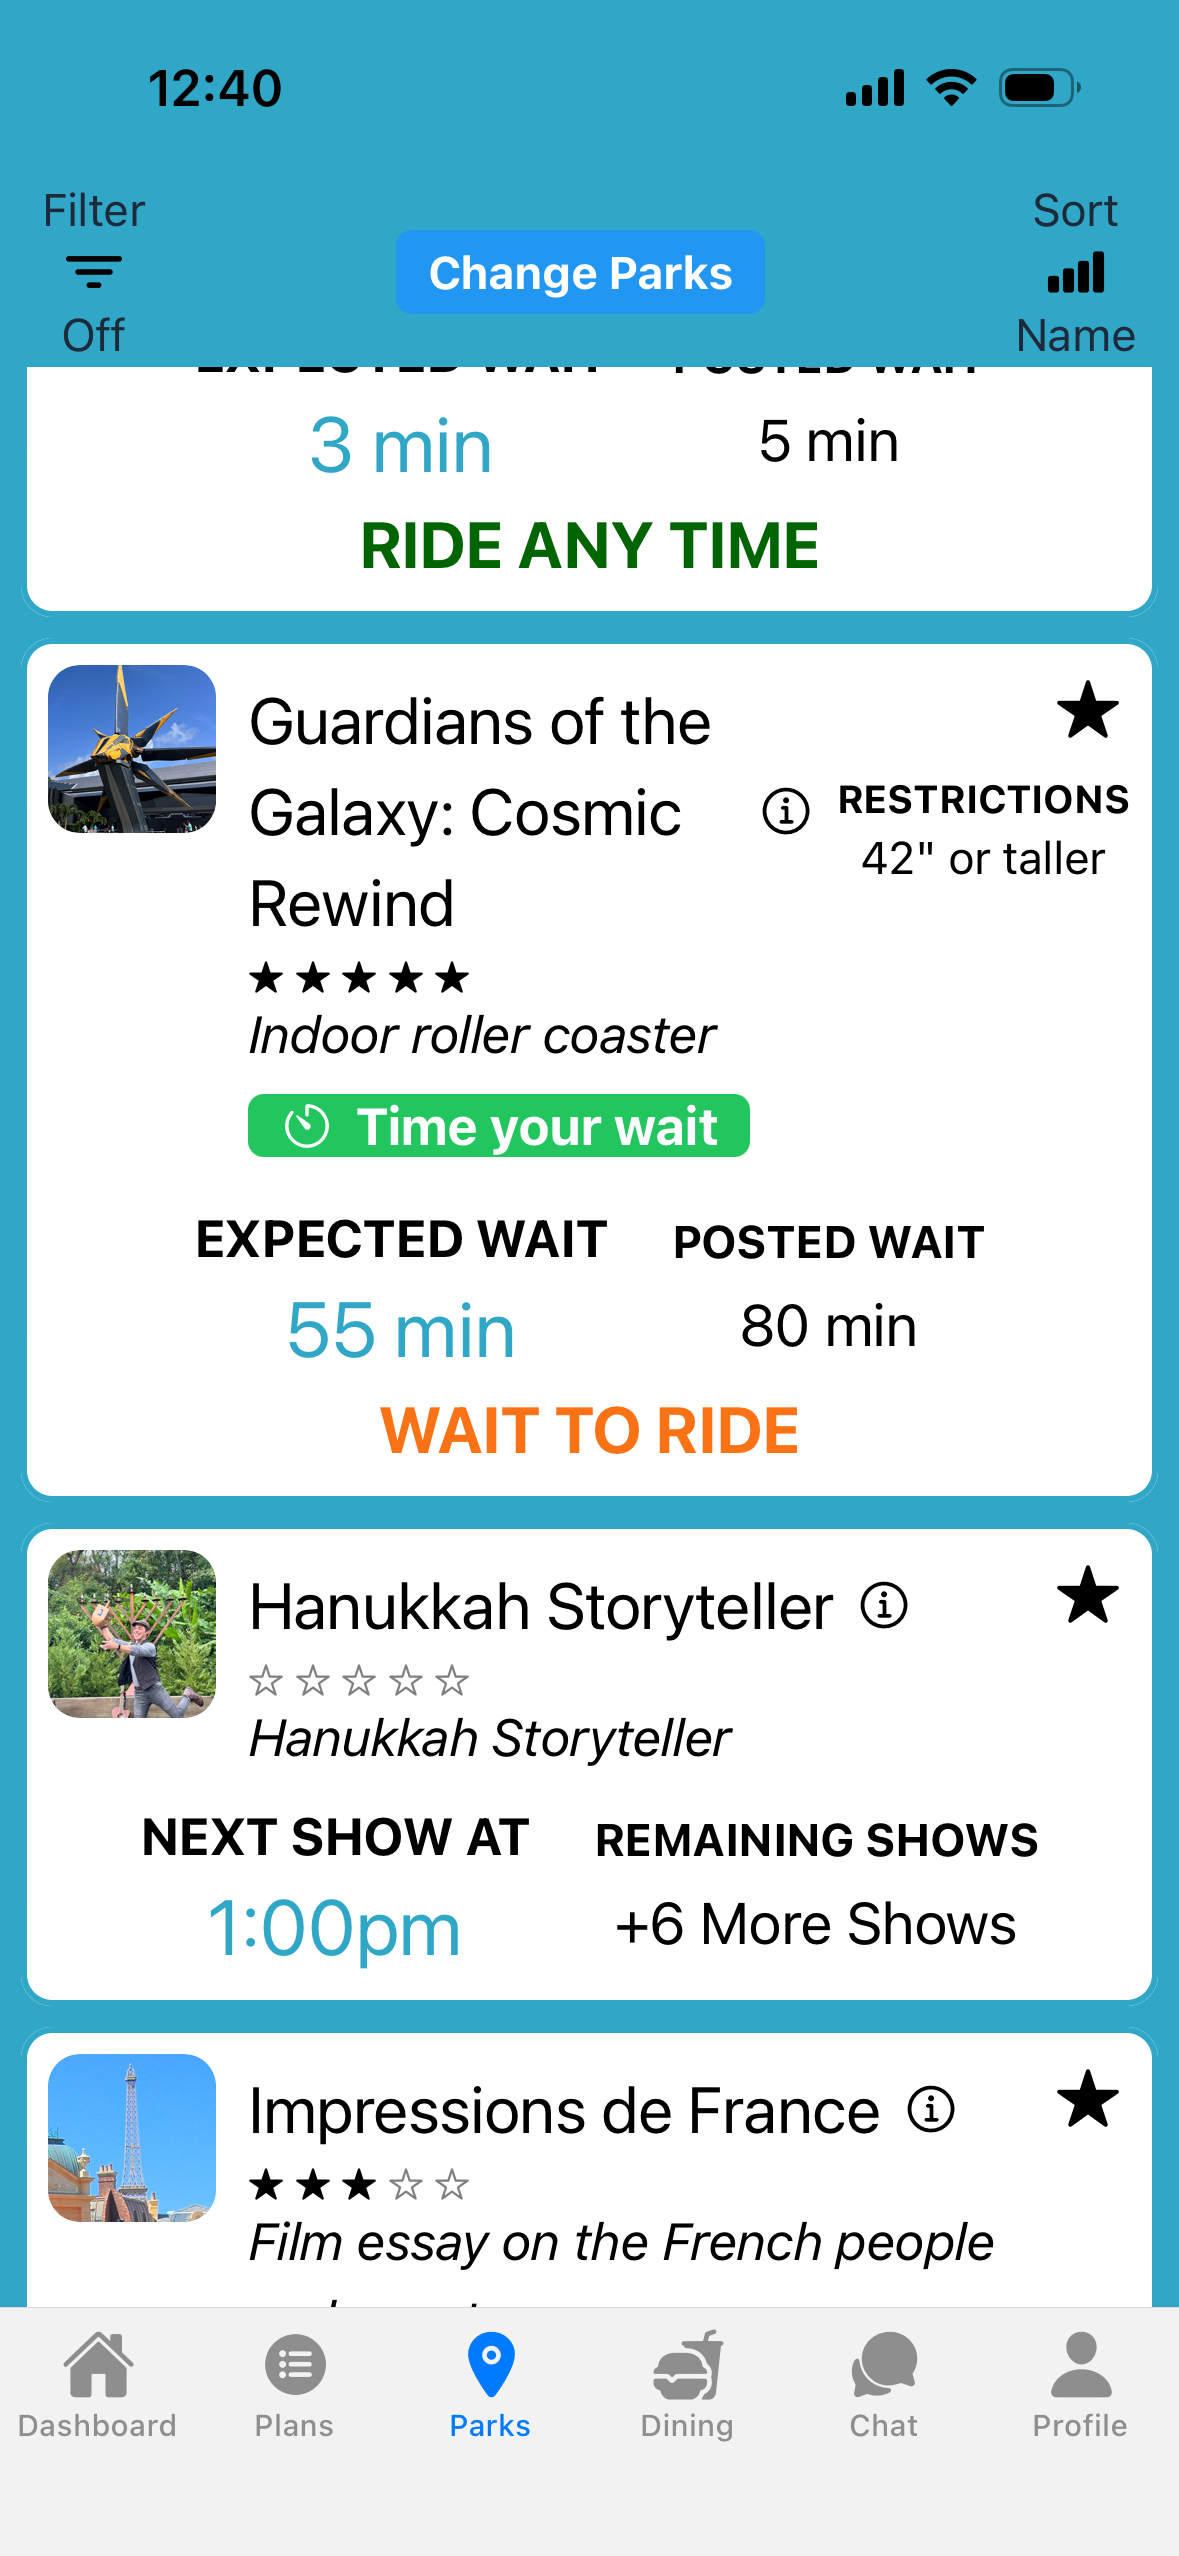
It’s at 12:40 pm, smack in the middle of the lunch peak (around 12:30 pm). So that totally makes sense: Guardians has a U-shaped wait curve: wait times are lower in the middle of the day.
I haven’t tried playing around with walking speeds or preferences. That might also affect the plan.
Just got back from a trip. I tried to time my standby rides. I didn’t time many, if any, of my LL rides. DD was hesitant to get in the HM queue with a posted 35 minute wait time. I told her TP has an estimate of less (i want to say it was 20 minutes or less). I timed the wait and it was almost exactly what TP predicted. LwtL was the same way. The TP predicted time was much more accurate and the posted time was an overestimate.
I understand the data you are looking at, and it will change day by day, but I did try to track TT and Guardians for a few hours today. I have a few questions:
Is TT more dependable at park opening these days? For years users have cautioned new users that TT often opens late.
What is the step before Guardians? Starting with TT and walking away from that area, only to come back, might feel like a bad idea to new users?
Finally, you are updating the wait times in the app ? Does that include advice to users? Guardians today at 12:40
I tracked the new intraday wait-time adjustments on my laptop and they were around 20% better than what we have in production. More importantly, they seem to adjust slightly faster when Disney makes large changes in the posted waits.
The most important metric I’m using for these new wait times models is “Is our estimate of your actual wait more accurate than Disney’s posted wait?”
To calculate that, I created spreadsheets of the new wait-time models and Disney’s posted waits, then mapped over all of the actual waits we got for key WDW attractions on Sunday.
These 7 models, at the 75% threshold, were more accurate than the posted waits:
Kilimanjaro Safaris
Na’Vi River Journey
Slinky Dog Dash
Runaway Railway
Toy Story Mania
Peter Pan’s Flight (especially in the morning)
TRON Lightcycle/Run
These 9 models were not more accurate than the posted at 75%:
Flight of Passage
Soarin’
Test Track
Guardians Cosmic Rewind
Space Mountain
Jungle Cruise
7DMT
Pirates
Haunted Mansion
And these 2 models tied:
ROTR
Tower of Terror
The good news is that where Disney did better, it looks like the 75% range was too aggressive - it was overestimating the waits. And the numbers were close. So I re-ran some of the models at the 63% threshold and they performed much, much better. I’m going to adjust all of those today and check again tomorrow.
For a first test of the new models, I think that went really well. Also, I’m automating these tests so we can more easily keep track of model performance over time.
Still on schedule to release all of this later this week.
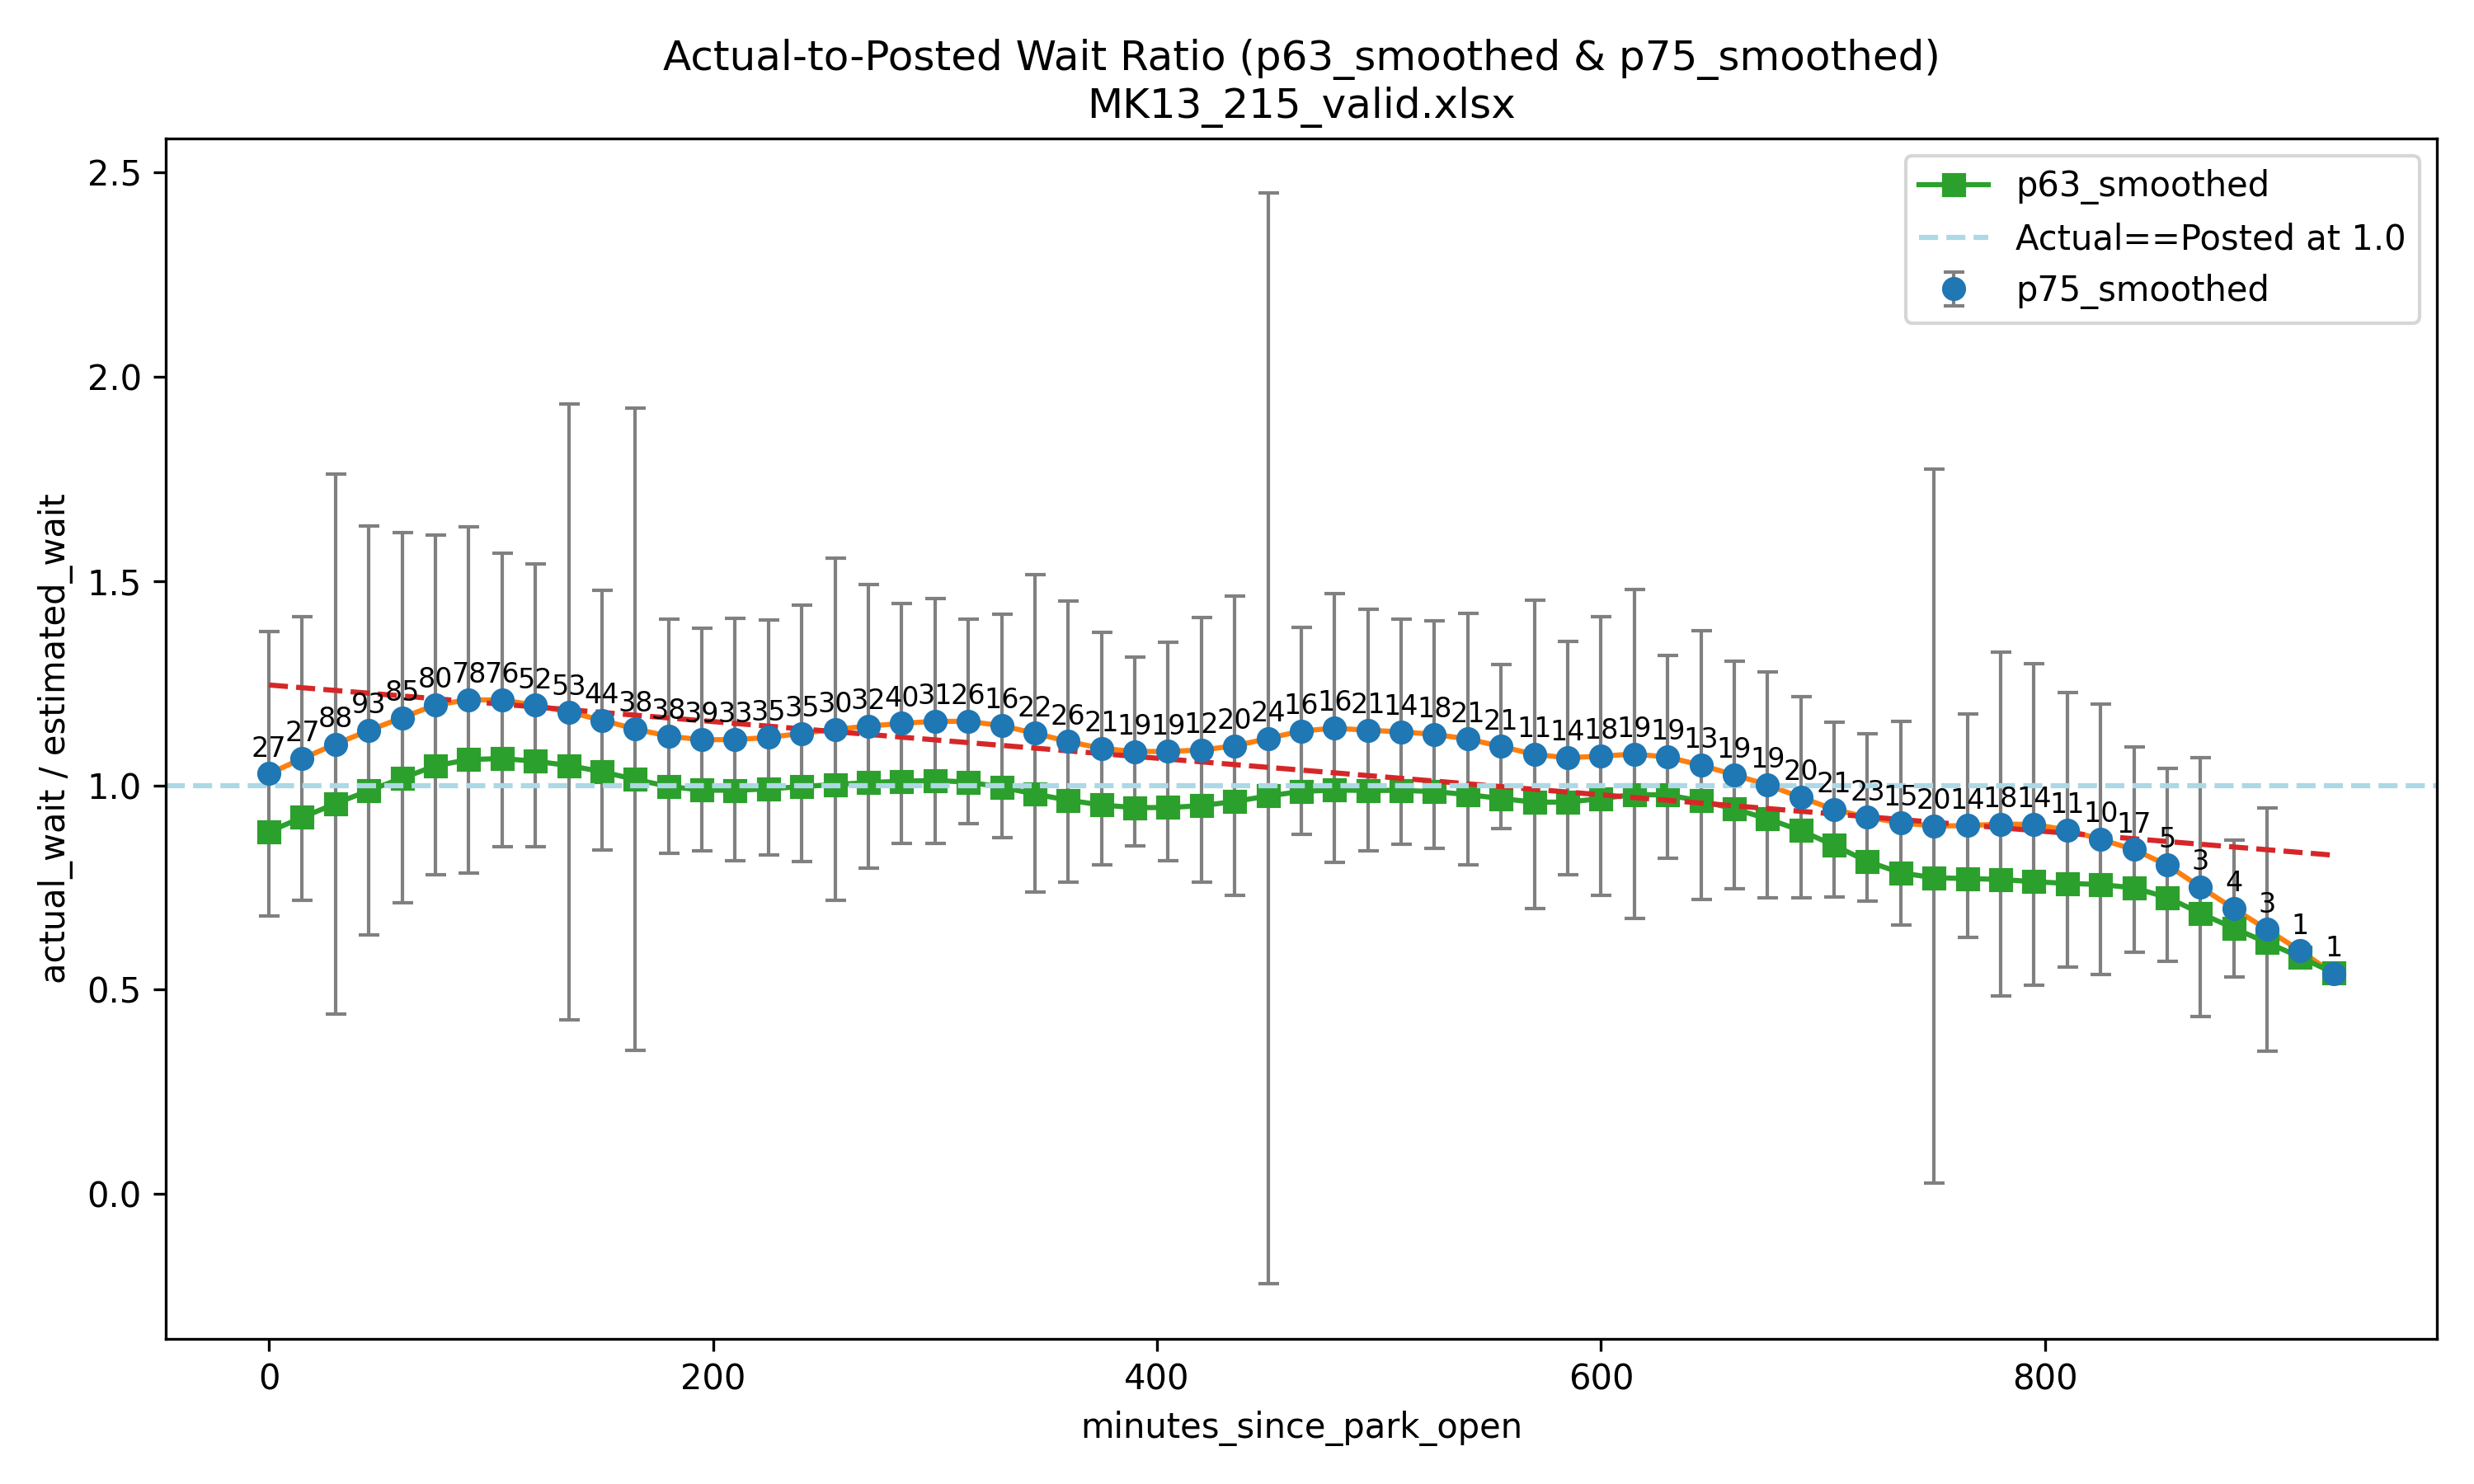
I know you explained it up above, but I didn’t quite understand it. For your graph, if the estimated wait is higher than actual, it goes below 1, so you are trying to find a line that is as close to 1 as possible, but preferably BELOW it rather than over it, right? So I see the green does a better job of getting it quite accurate most of the day, and when it isn’t, it is generally BELOW the line, which is a good thing (apart from the blip toward the beginning).
I’m not quite sure what the dotted red line means. Is that the actual wait time trend for the ride? So in this case, the trend is that wait times drop as the day progresses?
I’m also not sure what the gray bars represent. (And what in the world happened around the 450-ish mark???)
I have to pick either the blue or green line as the base “model” for estimating wait times.
Let’s take the leftmost blue dot, at time 0 (park opening). We have 27 actual wait times for this ride in the first 15 minutes the park is open. That’s what the “27” above the leftmost blue dot says.
We know the posted wait time that Disney had for each of those 27 actual wait times. So the question is: at time 0, what’s the relationship between the actual wait times and the posted wait times?
The gray bars indicate that the ratio is somewhere between ~0.4 and ~1.4.
That value of 1.4 means that we got an actual wait that was 1.4 times the posted wait (e.g., the posted wait was 20 and the actual wait was 28).
The value of 0.4 means that we got an actual wait of 8 minutes on a posted of 20 (again, as an example).
The line of blue dots marks the 75th percentile of those ratios. At time 0, that value is like 1.05 for the blue dot. That means that 75% of actual wait times have a ratio of 1.05 or less.
Going back to our example, if the posted wait is 20 minutes, then 75% of the time your actual wait will be 21 minutes or less (because 20 x 1.05 = 21).
The green squares are the 63rd percentile. For time 0 that value is around 0.85. So if the posted wait is 20, then 63% of the time your wait will be 17 minutes or less.
Here’s another way to look at it:
The top of the gray bars is the highest actual-to-posted ratio we’ve ever got. At time 0, that’s around 1.4. So if the posted wait is 20 minutes, then every actual wait we’ve ever got would indicate that you’re not going to wait more than 28 minutes in line (because 20 x 1.4 = 28).
If we used the top of the gray bars, then we’d essentially be predicting the absolute worst-case scenario all the time.
But worst-case scenarios don’t happen all the time, so that wouldn’t be good for users.
I’ve committed the code updates for the intraday adjustment process. It should be released to our test server tomorrow, and production on Thursday. This will address the original issue #2 and issue #3.
We’re on schedule to load new wait-time models for WDW and UOR by Friday. I have 6 to 8 more Magic Kingdom models to review, and they take about 10 minutes each to look at. That will address issue #1.
So Friday should be the first day with the new process and models.
We have a (new) issue #4, which is that the Lines app doesn’t always automatically refresh the page that shows wait times. Hoping to get that resolved next week.
also @len is there logic in tweaking the ratio based on time of day? e,.g we know disney inflates weight times towards park close and at open in some cases.. and what about a per ride basis?