I agree. I haven’t looked at any projected numbers for my upcoming Epic trip. I don’t think you can average the CLs in 2025 since Epic attendance is capped and US/IOA is not. Maybe the average would work in 2026 but isn’t it too soon to know that?
I just don’t think TP is being “shady”.
I don’t have concerns about the numbers but if subscribers do, I think they should reach out to staff. I believe Touring Plans is always responsive to questions and concerns?
The two recent examples of changes have been 1. Len reaching out about the Epic touring plans and 2. how actual/ expected wait times are displayed .
My experience has always been that David or another staff member will respond. For me, I was having an issue with the “my chats” section of the app. They worked with me on a solution I can work with, even through I know it is my own fault (the large number wouldn’t load). It took a while to understand the issue, and to test solutions.
I know they are guessing but why? Just leave it out and say you don’t have the data. People signing up and paying for new Touring Plans subs won’t know that and will see the numbers as fact. It’s shady.
Once again, we are assuming it is not right. I asked, did you?
If you subscribe to touring plans only for crowd predictions you are missing the true value of the resources and tools. That is just my opinion after years of use. You of course are entitled to your opinion but I don’t know what response you are looking for here?
I wonder though if the crowd calendar might be the initial reason for some?
For me, it was the graduate-level uber-planning information.
I do think that it should be as accurate as possible though.
Well, we still check the weather. If occasionally it rains when dry was predicted, we shrug. If the weather forecast predicted snow in all of September in Dallas people would be talking about the bad predictions.
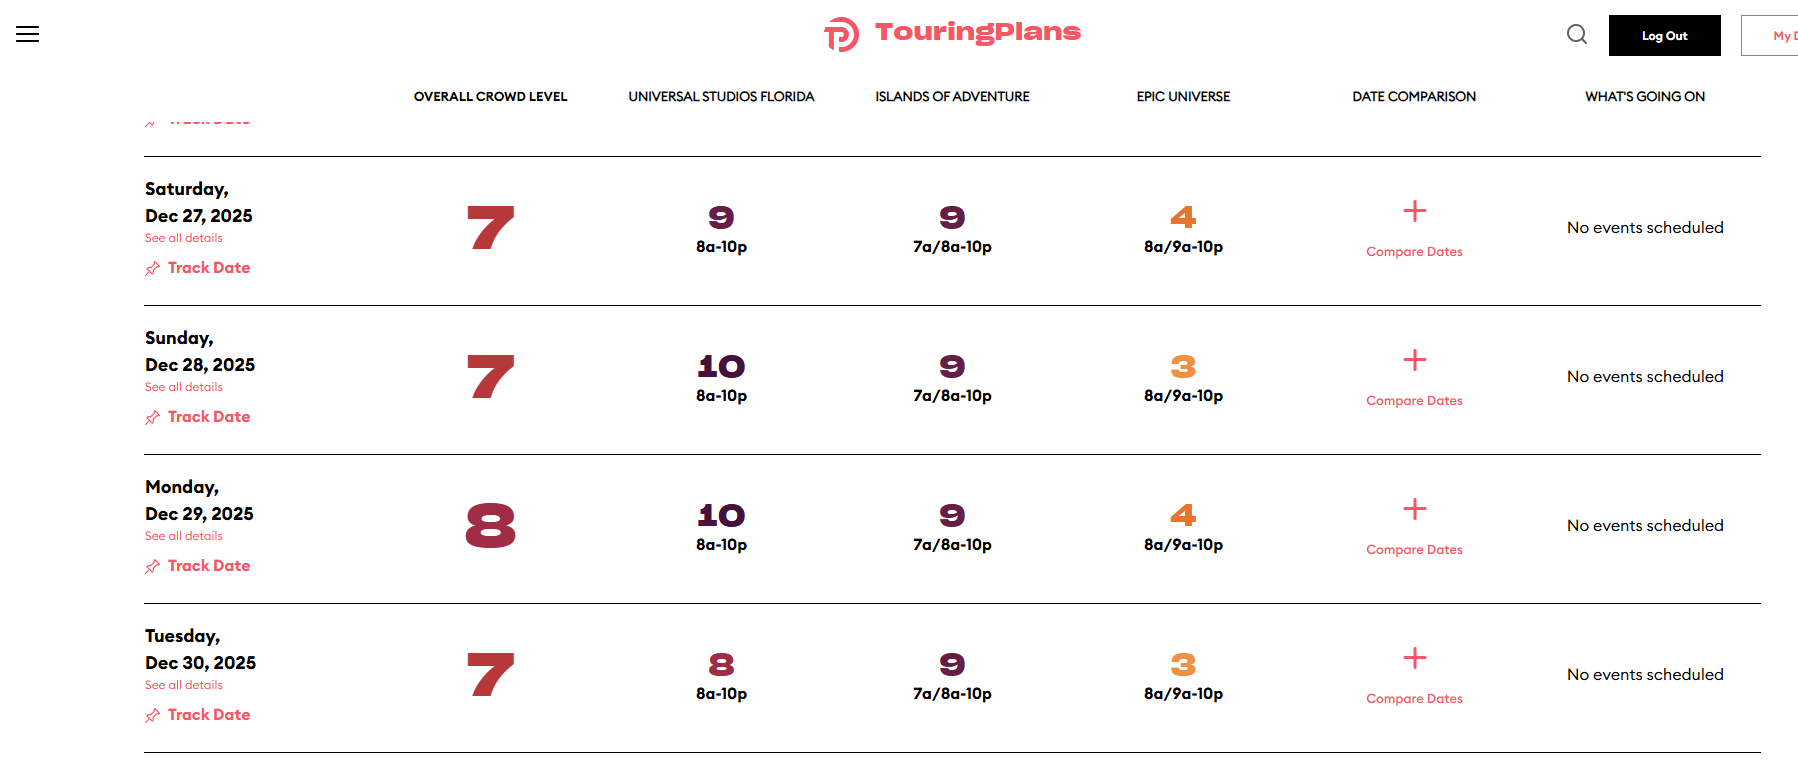
The highest wait I see today in Epic is 120 minutes. Those waits could in fact be a 3 at other parks? Similar attendance could keep the park at that level this year?
I don’t want to assume either way until TP can look at these numbers.
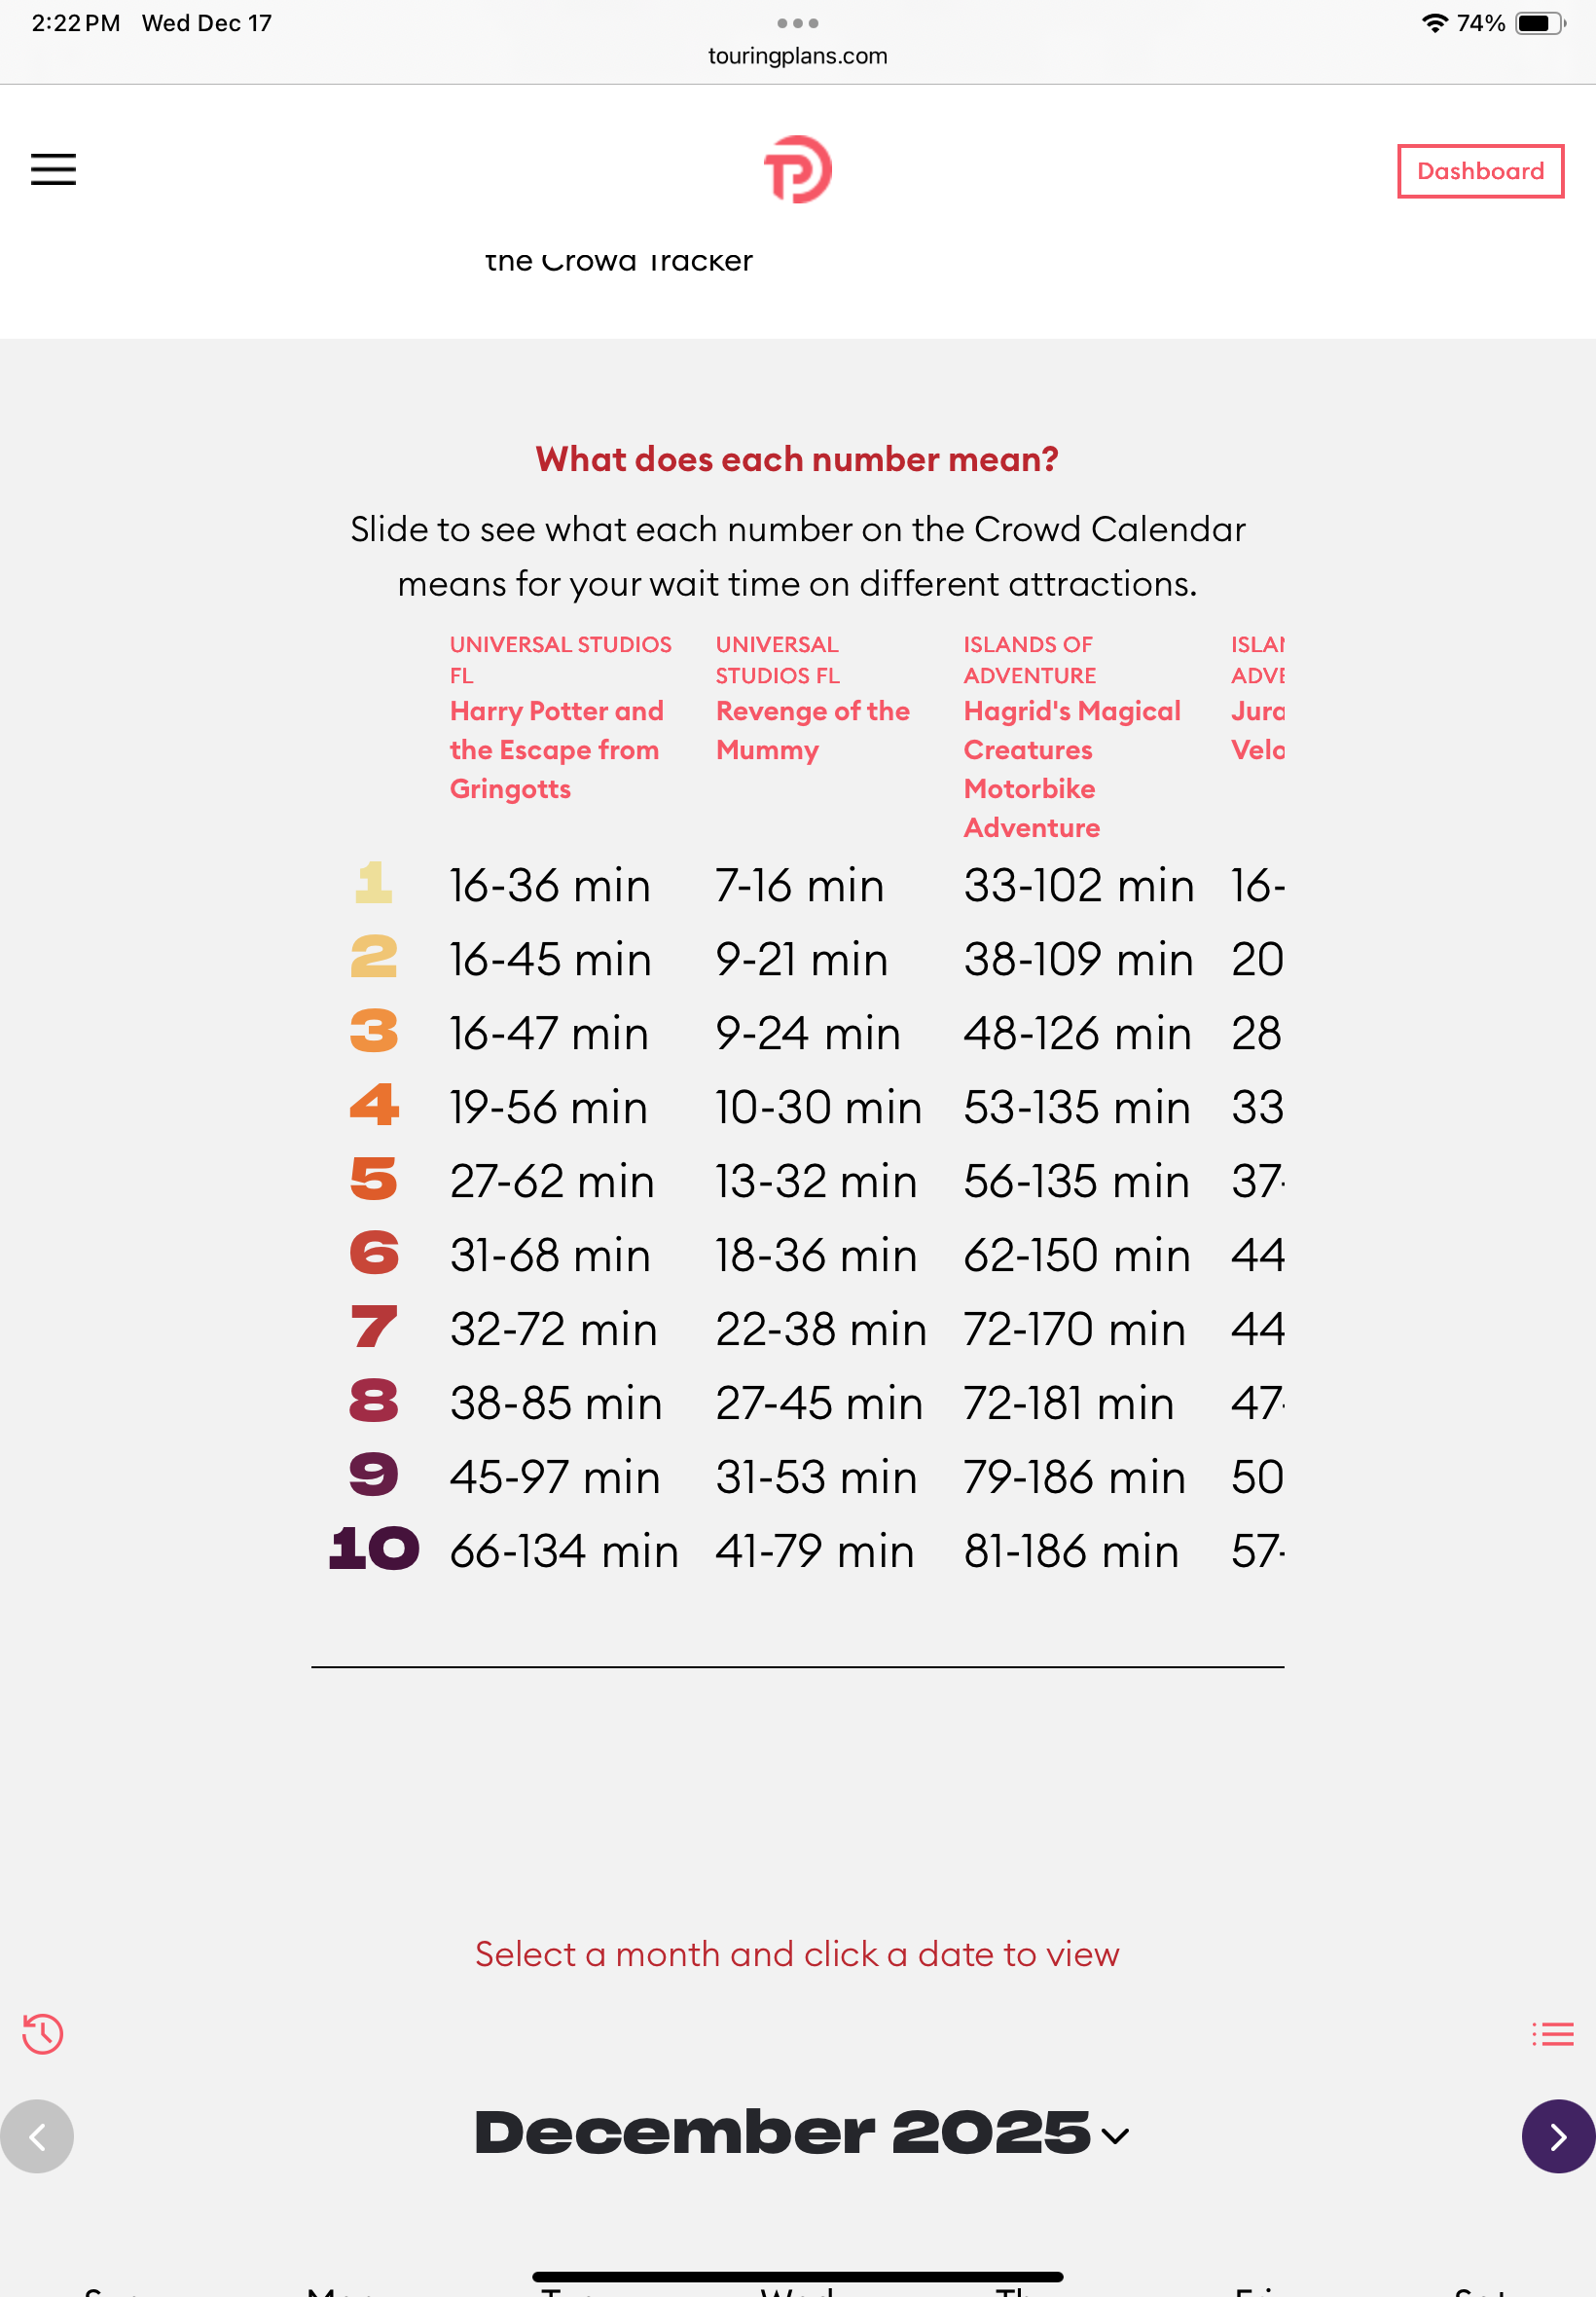
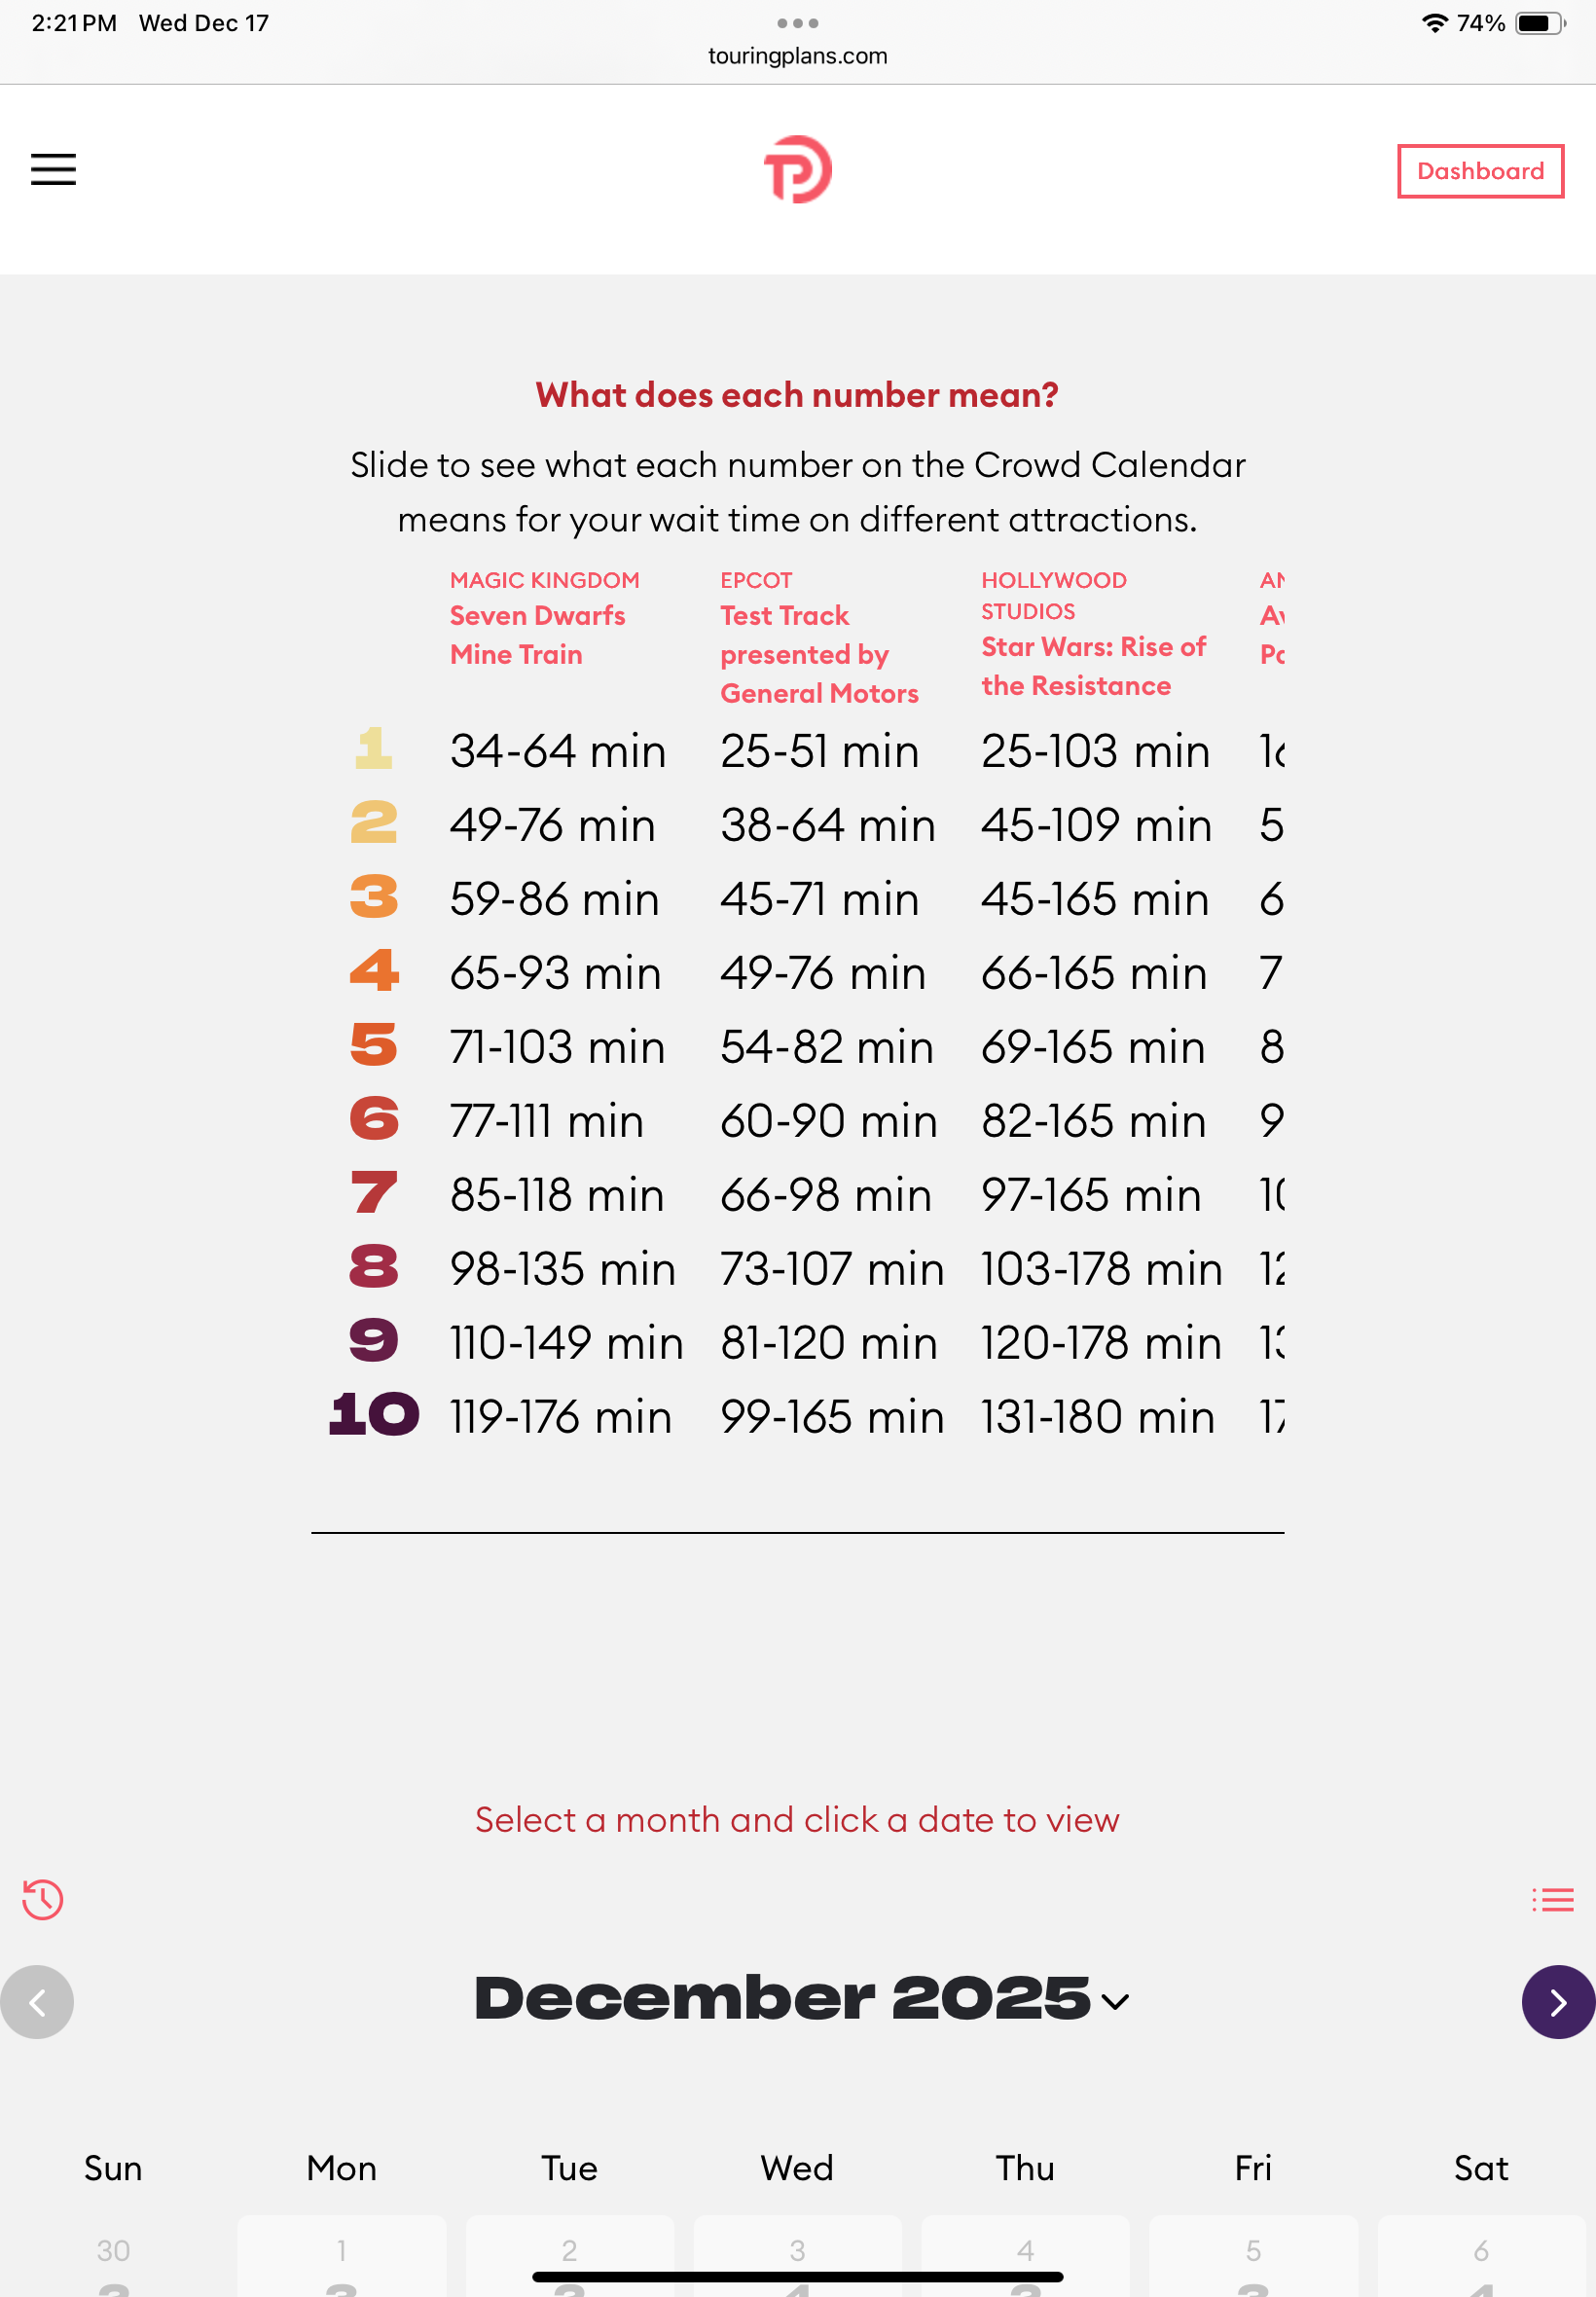
I haven’t been but I think most people compare BotM to RotR. I look at that chart and see an expected wait of 104 translates to an 8 at HS. Based on that I’d expect today to be classified as an 8, not a 3. The wait times do very widely, is that because RotR is still having mini shutdowns?
That much difference is like predicting snow in Sept in Dallas (I use that example because I rarely turn on the central heat before Oct)
I can understand when sometimes/frequently, the expected and actual waits are way off.
New park therefore rides are frequently shut down for problems, and then just when the breakdowns get included in the prediction for a bit, bam, the ride is reliable. So I can understand why expected wait times could be way off.
But, I don’t understand why the expected wait numbers and the crowd numbers have no relationship. Maybe there is a ride pair where the non-Epic ride has a tighter range?
The tiers are calculated independently for each park. You can’t really compare the same wait time for similar attractions between two parks.
The tiers are essentially percentiles, which I know a lot about because my kids are petite and we’ve had to watch their growth. A 3 is basically saying that Epic is a 30th percentile day for waits at Epic. If typical waits at Epic max out at 3 hours while waits at HS might max out at 2, using HS as a benchmark would be like comparing your child’s height using a growth chart for chimpanzees instead of humans.
This is of course a decision TP makes - they could choose to present the information any number of ways (including making wait times vs. tiers be consistent across parks, if they thought that was prudent), but in case, they’re pretty transparent about it all. It just takes a little effort to dig into the data and disclosures.
All that said, I think the best way TP could respond to the feedback is put more caveats in the places where the data is presented so people can more easily see all the qualifying language and limitations.
Never said it was the only reason. I’ve been a paying member of Touring Plans since 2007. I meant that many new subscribers probably do come primarily for the crowd calendar and it being a major selling point of the website, I would expect them to be genuine about the data.
You go to touringplans.com and the first thing advertised is the calendar. I say advertised because the first first thing is that since I’m a member it assumes I want to go to my dashboard.
RotR does have a wide range, which is why I mentioned comparing a ride with a narrower range.
Maybe the essential problem with the current crowd estimates is looking at the data only within Epic. If waits have always been on the long side because new park then that will skew the data. Wait times being slightly less miserable would lead to a low crowd number.
I think though that waiting two hours for a ride even a premier one doesn’t jive with CL of 3, at least in our crowd.
Most likely, but on chat for WDW there are weekly posts “no way today is a 3” but the next day you can check the predicted WDW vs actual CLs (the other two Universal parks too) and most often it is right or plus/minus one.
I haven’t been checking Epic times but I was surprised yesterday at 2pm to see so many ride at 40 minutes or less (Epic posted times).
Not just many, but most likely the majority. Personally, I heard of crowd calendars before I knew actual touring plans exist. I subscribed only for the crowd calendar.
I apologize for this. I’d updated the crowd calendar earlier this week, first testing it on my laptop then in our test environment, before uploading the changes to our production environment.
For some reason, the updates in production never got loaded. (It’s supposed to happen automatically, and I forgot to check.) I’m looking at that now.