When do Adjusted "Lines" Predictions get pushed to the app?

Good morning!

tl;dr, actual wait times appear not to impact the live forecast in the park, but only show up in the after the fact forecast data view?

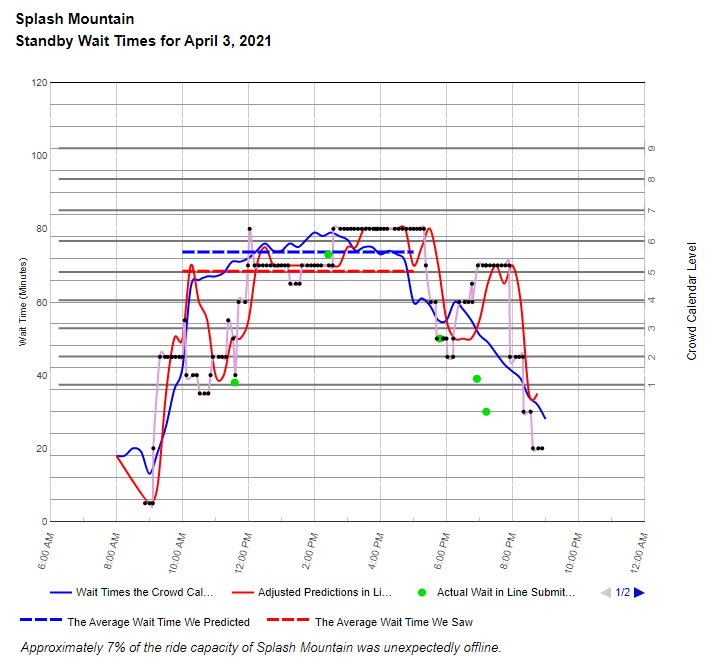
I saw a thread in lines yesterday which got me curious. Some liners provided actual wait times for Splash Mountain that was in the 80 minutes when the peak wait time for Splash Mountain in the app, and on the website was 40 minutes, with a posted wait time of 80 minutes. However, looking today the data appears to be what I expect in the app given the posted wait times. (which were double the crowd calendar predictions)

This screenshot from today’s predicted wait times is what the graph remained pegged at all day yesterday, including in the app. (I didn’t think to take a picture of yesterday’s predicted wait times in the app or the website, so I’m taking a screenshot of today’s predictions to show what April 3rd looked like ish yesterday)

image

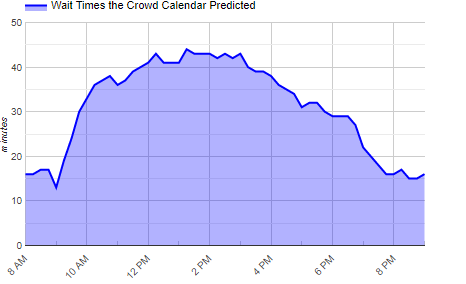
I checked at the end of the day yesterday on April 3rd after the “Disney World Wait Times” were pushed to the blog and the predicted wait times in both the app and the website were still pegged at 40 minutes.

I remember (I believe) in the past that submitting an actual wait time would result typically in an immediate correction for the forecast for the day. If it had followed the after-the fact first graph up there, that’s what’d I’d expect. But instead the graph for April 3rd’s Splash Mountain in both the app and the website stayed pegged at 40 minutes all day, not reacting to the actual wait time posted in the app.

Are live updates not working anymore? Is this an attraction specific glitch, or an app wide problem? Are updated forecasts only generated after the fact and not live?

Thanks.

Edit: Additionally, the wait time in the app and on the website never looked like the blue line in the after the fact graph, the “Wait times the crowd calendar predicted” line, only looking like the second photo all day times wise.

3 Likes

This is an excellent post.

1 Like

It is. Looks like we have another data junkie on our hands. :stuck_out_tongue_winking_eye:

@len can look into this and explain when he has time.

3 Likes

I love this!

The intraday models (the ones that forecast “today’s” wait times) take over once the park opens.

For now (but not for long), we mix in actual wait times with posted wait times when figuring out how to forecast the rest of the day.

That’s not perfect, because if Disney’s posted wait time for BTMRR is 40 minutes and we get 4 of them, and we get 2 actual wait times at 10 minutes, then the average we show is 30 minutes, when we know it’s closer to 10.

We’re working on a way to put more weight on the actual wait times. To do that, we probably need even more actual waits, and that might be possible by improving the UI a bit more.

4 Likes

That’s what I figured, but if a submitted actual waits are, for example 82 minutes at 1:13 PM on April 4th 2021 in this screenshot taken at 6:30 PM and the posted wait is about 90 minutes (I’m guessing) at 1 PM why is the lines app showing a wait time of 41 minutes at 1 PM right now instead of something in between those two figures? Is this weighing historical data?

I’m sorry that I wasn’t clear but I was concerned there was a bug somewhere in the pipes? To me it looks like the data is getting crunched but not getting pushed?

Let me walk through what I am seeing happening on April 4th 2021.

a) From Park Open to Park close, this data appears both in the app and lines. These screenshots were taken after park close and at 6 PM respectively Eastern Time April 4th 2021.

image

b) On April 4th 2021, Actual wait times are being submitted as shown in the first screenshot in this reply which are in excess of the predicted waits. Additionally, posted wait times by Disney are also in excess of the predicted waits for a given wait time, so the expectation is that the wait time predictions would be halfway between the two figures. (Between 80 and 90 minutes) However, the predicted wait times remain pegged at a point about half of both the posted wait times and the actual wait times at 40 minutes throughout the whole day in the lines and website. Despite posted waits of 90 ish and actual waits in the 70 range, predicted waits never exceed 55 minutes throughout the whole day in the app and the website.

c) I predict that the day after, on April 5th 2021 the crowd calendar portion of the touring plans site shows a result for April 4th 2021 that has two characteristics

i) It has an “initial” blue crowd calendar forecast for April 4th 2021 that is incongruent with the forecast shown on the website on April 4th 2021

ii) It has an “adjusted” red crowd calendar forecast for April 4th 2021 that is incongruent with the forecast shown in the app on April 4th 2021.

This is what I was trying to say with my initial post, I am concerned there is a bug because the “initial” predictions for April 4th 2021 shown on April 5th 2021 are not matching the dataset provided for the date of April 4th 2021 on April 4th 2021.

Going back to my initial post, I am expecting to see data in the app that looks like the red line or even the blue lines when looking at the lines app on Date X, but the data only appears to be correct on Date X >= Date + 1.

2 Likes

Ah, I think I understand. Let me ask @SteveBloom to weigh in with what’s going on. It could be that I’m wrong.

1 Like

It’s all Greek to me but thank you so much for noticing and posting!

3 Likes

Good morning,

I’ve got some screenshots I’ve taken today to provide further evidence of what I believe is going on.

Here we have the dataset for April 4th 2021 collected on April 5th 2021, posted on the website.

Again, here is the dataset for the “Wait times the Crowd Calendar Predicted” for April 4th 2021 collected on April 4th 2021 after park closing but before April 5th 2021 from the touring plans website.

image

As you can see, the blue lines that should be the same don’t match, but they should if these are indeed supposed to be the same “initial” predictions for the day.

Likewise, again for quick comparison is the lines app data for April 4th 2021 collected on April 4th 2021 at 6 PM Eastern Time.

image

My expectation is that this forecast should look similar to the red line in the first screenshot in this reply up to 6 PM, however, it does not appear that the lines app forecast the day of is responding to either actual wait times or posted wait times.

Pardon me posting this on the forums first, as I wasn’t sure if it was a bug and wanted to know if anyone else could chime in and point out something I had missed as I felt crazy for noticing this.

1 Like

I am thinking the same thing. My brane hurts. I pay these guys to think about this stuff so I don’t have to :laughing:

6 Likes

Seriously though, this is why I love TP. Where else can you have something you love (Disney) merge with math and science in a meaningful way that actually impacts you? Here the folks running and working on the product are able to interact in a way to explain why something is right or wrong and correct it if needed. On top of that, a passionate community that also seems to appreciate what goes into making the product what it is. I am always in awe of this.

Disney + nerds. I have found my people.

14 Likes

So there is a lot going on here. There is not a bug or error happening. We (Touringplans) could do better in presenting the data.

Before a given day, we have two sets of predictions for each attraction. We predicted the posted wait time and the actual wait time. For future days, and in the app, we are showing actual wait time predictions.

The chart we are showing for days in the past, shows more data but does not show predicted actual wait times. These charts were initially designed to visualize our predictions of posted wait times, and how our predictions evolve during the day.

The reason we show posted wait time data on the charts is that posted wait times are constantly available and we can validate our predictions. Actual wait times are what are more important, but more difficult to evaluate.

For any submitted wait time (posted or actual) we have to detriment if the submitted wait time is accurate. If something looks fishy we will put it in “quarantine” until we get additional data to validate it. So not every submitted wait time will have an immediate impact on the app’s predictions.

If you look at my blog post I have another version of these graphs. The red line is the intra-day adjusted actual wait time prediction. The Black dots are the posted wait times.


The image above, which is from the blog post, is an example of a model that has been since corrected. Even with all the submitted actual wait times, the predictions were too high. Mostly the problem is the disparity between Disney’s posted wait times, and the actual wait times.

6 Likes

I see my misunderstanding now, thank you!

I so agree with this. Where else could a question like, “What color should I use for Epcot in my Excel trip plans?” get real answers instead of rude responses.

I told DH that there was a group that vacation plans like I do (and maybe more so). He was pleased for me, but shocked that there was enough of us to make a group. Before I found this group, my Disney research felt like everything was picture books i.e. children’s books and not the cool coffee table books. Here is the graduate level training.

7 Likes

Purple, obvi

3 Likes