We’d like to make the site’s charts prettier for displaying things like an attraction’s current and historical wait times, and Genie+ return times. My goal is to make the chart:
Prettier than what we have now
At least as easy to understand for the casual reader
More likely to be shared on social media if something notable is happening (like really low or high wait times)
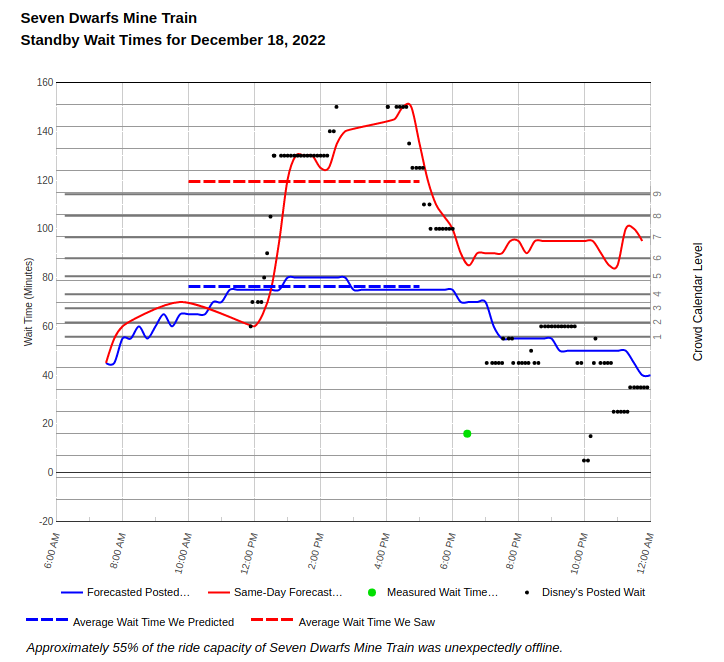
As a reminder, here’s what the current wait time graph looks like:
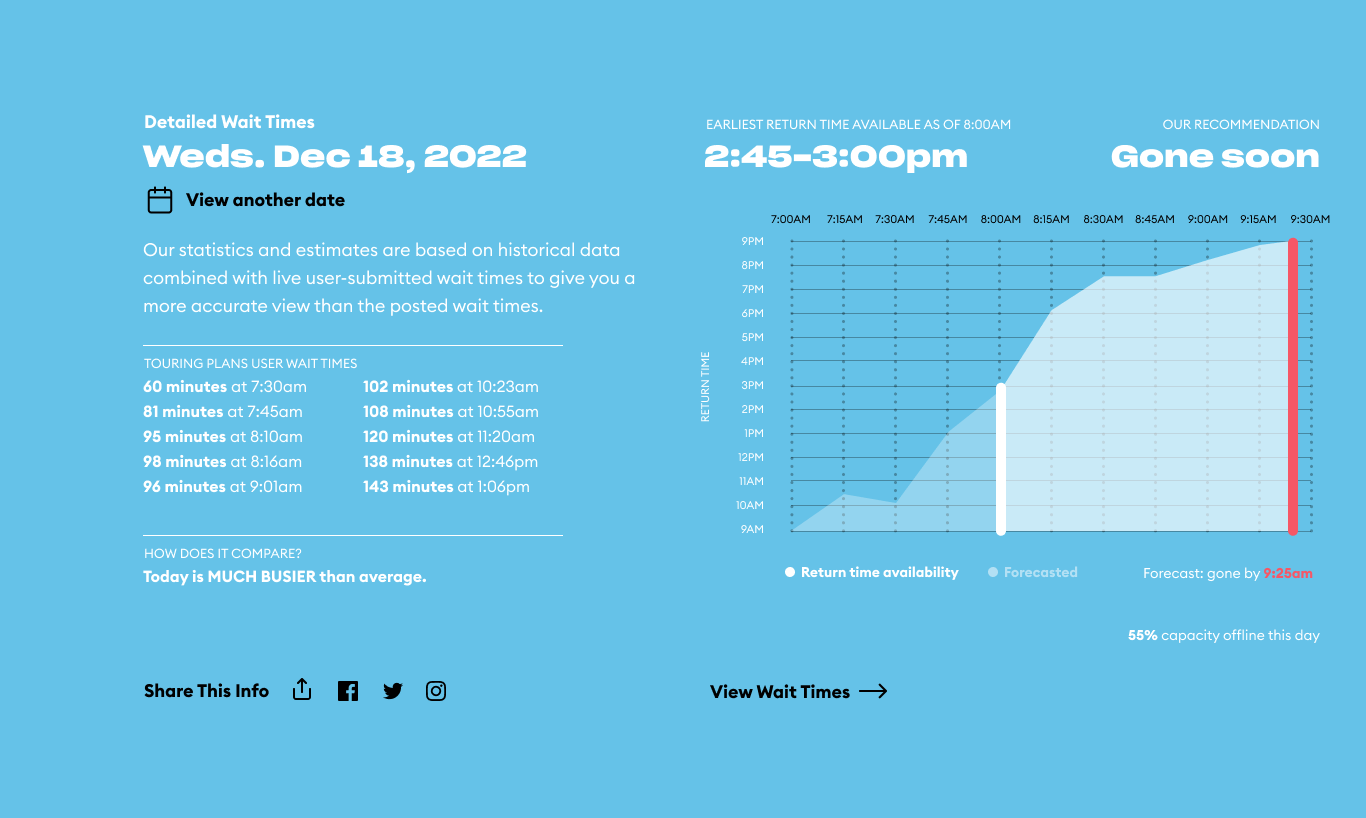
I agree with @MeetMeAtThePoly that the red is easier on the eyes. It’s also a great improvement over the current graphs which are very complex and hard to read on a phone. I like the Ride Now and Reserve Now additions. An easy arrow to go back a few days easily would be nice. It looks like the redesign allows you to change the date but not in an easy tap the arrow format.
In regards to the LL charts, agree with the others that red one better eye appeal. Also, the graph makes more sense in that one to me. For some reason I can’t seem to comprehend the blue graph and why the chart would go up as availability goes down.
Edit to add: I do like the “forecast gone by” in the blue.
Edited again to add: Actually if the blue one had the y-axis inverted, so 9 AM was on top, then I think I would like the blue graph better.
I think the red AND the blue colors could be better if they were made MUCH darker, if you plan to use white text. You need greater contrast between text and the background. (This might be why the blue is harder than the red…the contrast isn’t as good.)
I kind of think using a colored background might be a problem. for me, in both cases (blue and red) parts of it look almost blurry. (Blame it on my 50-year-old eyes…but I have less problems with black text on white background or white text on black background.) But I definitely agree that it is more difficult to make out some of the text on the blue background. (In particular, the y-axis labels on the blue background are almost illegible to me even after I clicked to the full size image.)
Assuming I’m reading the charts correctly, I think I prefer the blue chart (not in terms of color, but in terms of how the data is presented), because it feels more natural to me. I had to think about it in the red presentation. I was expecting the y-axis to tell me when I would like to have my LL for, so the graph reads more natural. In the red graph, the way the data is presented is backwards from how I would expect it.
I agree with @ryan1; which ever color you go with it needs to be darker/more saturated. As someone who has designed 1000s of PowerPoint slides, contrast and font size are the two critical factors for legibility. I like blue better, but that’s just a personal color choice. But even as they are in the mock-up, they are 100% better than the old (current) version.
One small point is that I think the name of the attraction should be on each page. I’m sure in the context of the app you know what ride you are clicking on, but if you are considering portability to other apps, the name needs to be there.
I like all of the blue graph better - it just makes more sense in my head. I do agree that I’d like to see more contrast, though. Darker blue/red. (Blue is my personal preference). I like the forecast of when LL will be gone.
I do like to see the logged waits (green dots) in the current charts, but understand if those are difficult to display with the new charts.
The other thing that I’d like to see links for is to other dates (you have) for this ride, other rides for this date, and the summary of all rides for this date. When I’m looking at this info, I’m often comparing multiple rides (and maybe multiple dates) to figure out which LLs I need to try for first.
As a total historical graph data junkie, I’m glad to hear of the complete redesign. Mainly because it’s too busy and also because the language is not currently clear.
A while back @rgandillon and I had a conversation about the historical data and how it is portrayed as being very confusing. I assume Becky is assisting you in the new design. If not, please get her involved!
That’s the current historical graph. I do love the green dots (I think it’s essential to keep each measured wait time by a user on the historical graphs. They have been so helpful time and time again, ex. finding an actual recent wait time during Early Entry).
This one looks more like the current/forecasted day, not a historical data graph. Would you have a better example of newly designed historical graph?
I don’t know how the new historical graph pages will be. But, the main things I was critical of regarding language was:
“Average Wait Time We Saw” should be “Average Posted Wait Time We Saw”
And “Observed” should be changed to “Posted” because observed is a confusing word that could mean actual or posted depending on the reader.
I prefer the axis setup on the blue graph. It was momentarily confusing for me that the booking times were listed along the top. I expected them to be along the bottom.
I like the new wait time chart. I always get confused on the current one on what line means what, I like the Red one better as it is more intuitive for a dwindling resources. I would suggest putting the times at the bottom instead of the top and there doesn’t seem to be a label on the horizontal line saying what the times represent. The vertical times has one, but I would put a label on both.
I agree with this, although I would say “should” instead of “could”. It’s got too much emphasis in that position considering it’s just a description of what TP does. At least put it below the “How does it compare?” section (and probably a smaller font).
I also agree with the concerns about contrast. If the same background color can have both black text and white text on it and both are kinda/sorta readable, that probably means that neither one is readable enough for a good chunk of your users.
Ok - so looking at this even more.
I much prefer the return times on the vertical and the booking time on the horizontal axis. I also think it might be helpful to keep the horizontal axis fixed. For example, some rides will run out at 9:30 am, but some will have availability all day. I want to see the ones that run out quickly have a long period of “nothing” so that I can easily visualize which rides are highest priority.
I don’t know that I care whether the 9AM is at the top vs the bottom of the vertical axis. I personally prefer 9AM at the bottom, but I do understand where others would like it at the top, and the chart “runs out”.
Oh - the other thing I think would be helpful is to have a line for when the park opens for that day. Mostly, I think that’s useful for when you can’t book your 2nd LL until 2 hours after park open.
I found the time being at the top of the graph vs. the bottom hard to follow. It would be easier to read at the bottom, even with the times listed there.
I found the blue way easier to read (but would prefer black on white). I also thought the graph made more sense as it’s building vs. doing down (the return time is increasing and running out vs. the red graph).
I LOVE the more modern and clean look.
I you feel comfortable sharing, I would love to know what you are using for the visualizations, since that’s what I do in my real life.
I like the presentation (downward slope) of the “Red” chart better since, at a glance, I can intuitively understand the urgency of diminishing LL availability.
The red and blue graphs are actually inverting the x and y axis, which is what I do NOT find intuitive about the red. But I can agree with those that the downward trend of the red also seems intuitive. As other stated, if you change the times on the y axis in the blue graphs so that the top is the earliest time, and the bottom is the latest, you will present the same data but in a more intuitive downward trend.
I do agree that it is somewhat unusual to do time that way when in a graph…but, I think it is an easy adaptation because we also naturally think of time as far as calendar presentations being shown with the earliest times at the top, and progressing downwards.
I just can’t wrap my head around the actual data that the red is presenting, ignoring the “general downward trend impression” aspect.