Those of you who have been following my 2019 WDW trip planning know that I’m in that awful lull between ADR and FP days. So, I have a little (and I do mean little) time to do a deeper dive into some of the things I’ve put together to help my decision-making. I’m even going to share the working files themselves. I’ve put a lot of time into organizing information from different sources and I’d like the entire Liner community to benefit from it.
The first creation I’m sharing is “2016-2018 Crowd Levels” . My primary goal was to gather data to support my decisions for which week to go and which parks to visit each day. Unfortunately for many of you, my dataset is not actually complete. Sorry. First, as you can imagine, this process was very time consuming, so I decided to only include the previous 3 years (2016-2018) of data. Second, I was only concerned about crowds during October, November, and December as that was the general timeframe I was looking at for our trip. So, those are the only dates I’ve included here.
The tool can be found in my public WDW folder. The Google Sheets version can be viewed directly here, and the Excel version is here (download button is at the top right). Note that there are multiple sheets, tabbed at the bottom. I tried to explain everything step-wise in the spreadsheets, but I’ll also do that here.
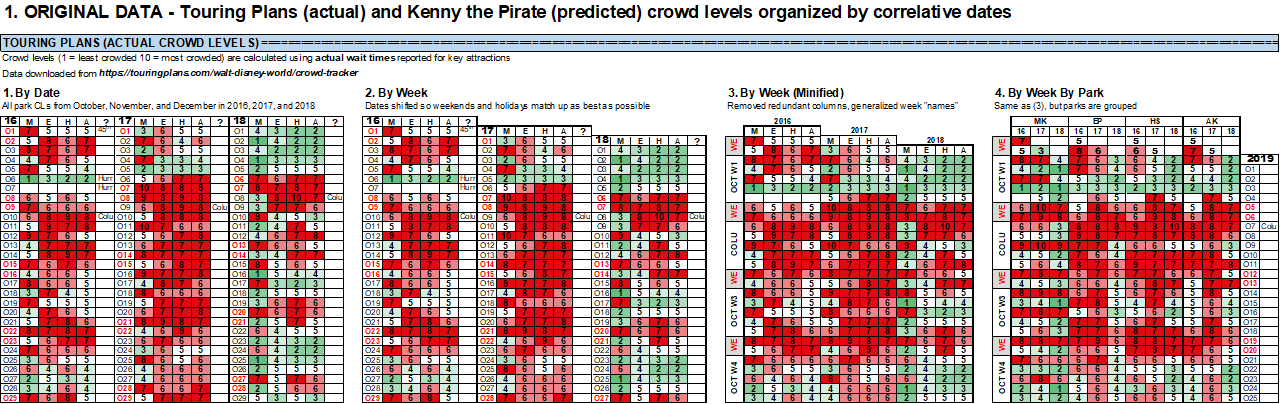
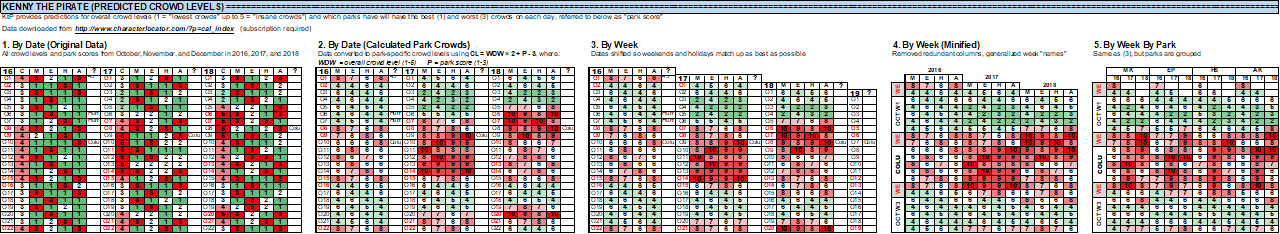
First, I downloaded historical (actual) crowd levels from Touring Plans at https://touringplans.com/walt-disney-world/crowd-tracker and predicted crowd levels from Kenny the Pirate at http://www.characterlocator.com/?p=cal_index (subscription required). The former was chosen because it was the only dataset I found to be based on some ground truth (in this case, reported wait times). Kenny the Pirate’s data were included because I had read in multiple places that his park-by-park predictions were usually correct, and that he has “inside” info on certain aspects of the park calendars. So, I thought it would be useful to look at this dataset alongside the other.
For both datasets I shifted the dates to match up weekends and holidays. For 2016-2018 this worked very well. However, when comparing with 2019, keep in mind that Thanksgiving is the 4th week of November, not the 3rd (like the previous 3 years).
Finally, the KtP dataset needed an additional preliminary step. For each day, Kenny rates the overall park crowd (1 = "lowest crowds" up to 5 = "insane crowds") and which parks have will have the best (1) and worst (3) crowds. I refer to the latter as a "park score". To compare these with the TP dataset, I played around with some simple math to convert these numbers into park-specific crowd levels ranging from 1 to 10. I have no justification for the results, but the results are similar to the TP dataset in magnitude and variation. I ended up using the following equation:
Crowd Level = WDW × 2 + P - 3, where:
WDW = overall crowd level (1-5)
P = park score (1-3)
First few rows of each dataset:
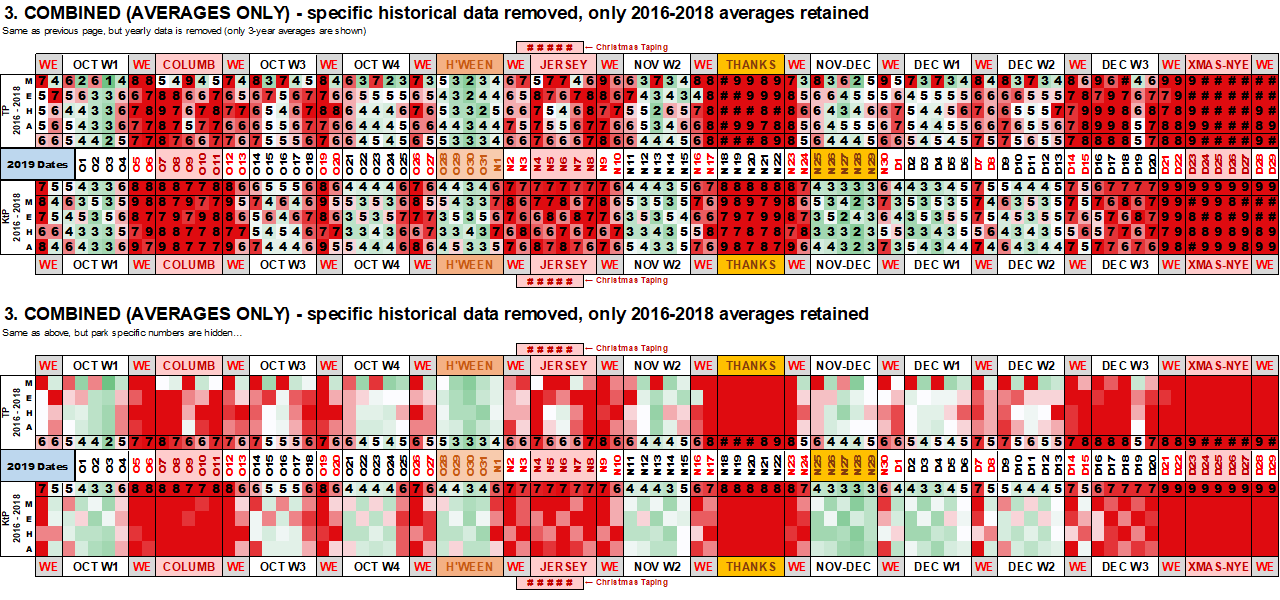
After all the data was compiled and organized, I copied it onto a single “calendar” and transposed everything so the calendar reads horizontally instead of vertically. The equivalent 2019 dates are shown in the very middle row, and moving up (TP) and down (KtP) are 2016-2018 average crowd levels (overall and park-specific).
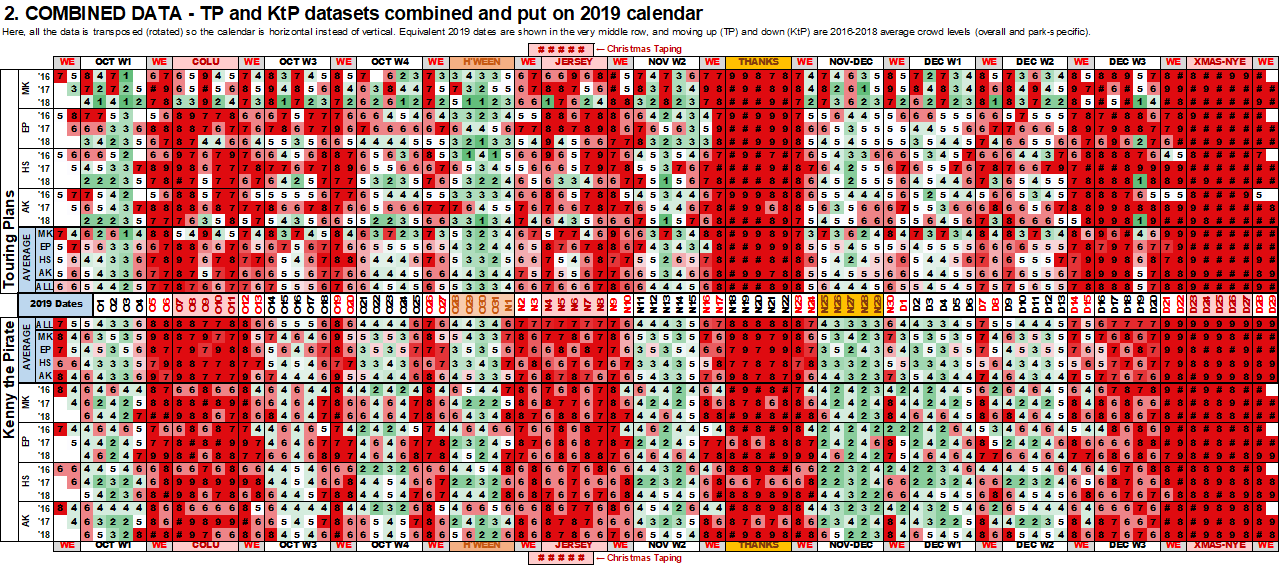
Here is a simplified version with yearly data removed (only 3-year averages are shown).
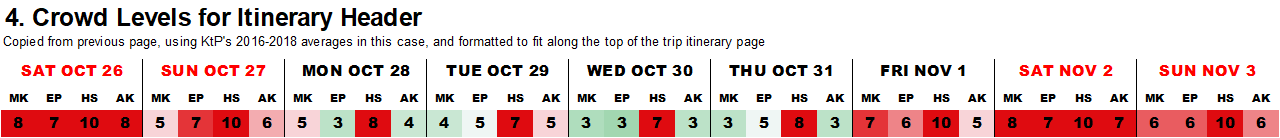
Finally, I copied the numbers I liked the most into my itinerary header, which I’ve included as the last sheet in the file in case anyone else wants to use it as a template.
Note: I adjusted the HS crowds to reflect the SW:GE effect. Those numbers are just my own wild guesses.